Case Studies · Ozone AOP

Ozone Nanobubble Oxidation & AOP Cases

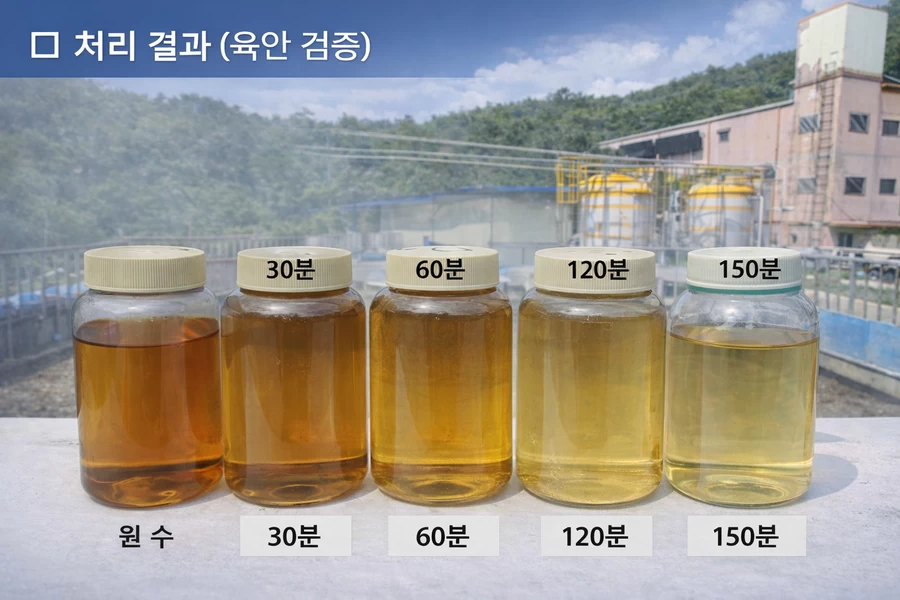
Cases cover organic color, textile and livestock wastewater, and Fe/Mn oxidation, with results varying by water quality, temperature, ozone dose, and reaction conditions.

CASE 01

Oil-Based Ink Oxidation & Decolorization

Ink color decreased over time, confirming basic oxidation behavior and potential for organic-color treatment.
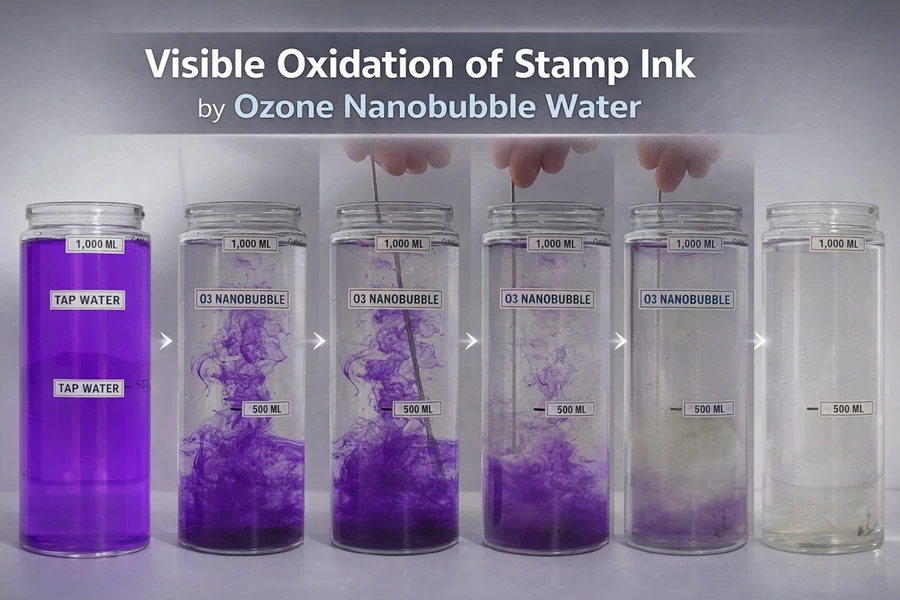
Oil-based ink oxidation and decolorization with ozone nanobubbles
Ozone Nanobubble Oxidation & Decolorization Confirmed
Measured: 2022.03.22 (water 9.0°C)
Test Target
Oil-based stamp ink
Evaluation
Oxidation and decolorization of ink
Observation Decolorization observed with oxidation
Implication Potential for organic color treatment

※ Basic test only; results vary with contaminant, ozone level, temperature, and reaction time.
CASE 02

Ozone Treatment under High-Temperature Textile Wastewater Conditions

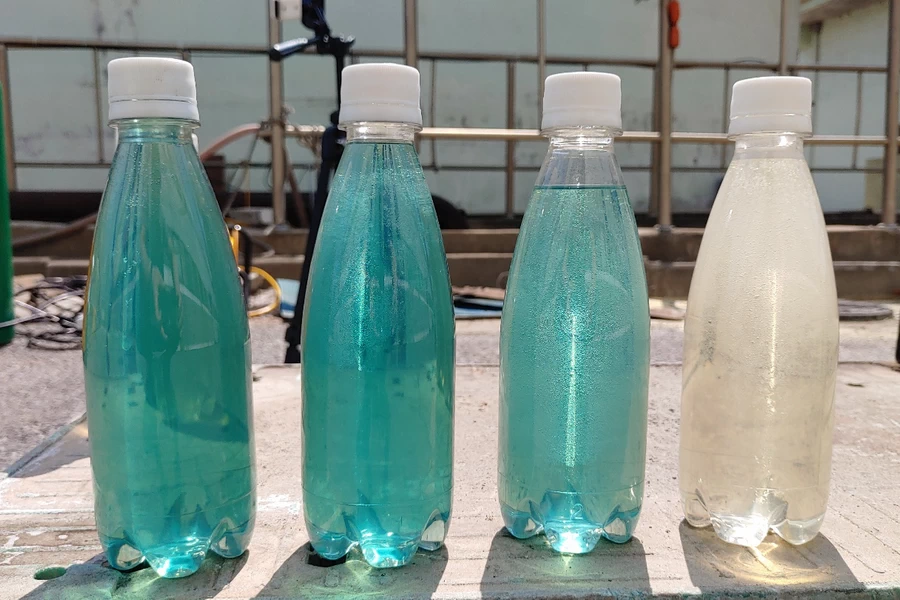
Above 80°C, ozone retention and oxidation were less favorable, and some blue color remained; temperature and reaction conditions require control.

Measured color change in high-temperature textile wastewater with ozone nanobubbles
High-Temperature Treatment Limitation Confirmed
May 2022 · Textile plant in Sintanjin, Korea
Influent
Textile wastewater treatment influent
Ozone Generator
20 g/hr
Actual Ozone Feed
0.1 g/min
Water Temperature
Above 80°C
Evaluation
Color change and high-temperature effect
Temperature Effect Unfavorable condition for ozone treatment
Color Behavior Blue color showed greater residual tendency

※ Data reflect the specific temperature and water-quality load tested.

CASE 03

Livestock Wastewater Secondary Effluent

Secondary piggery effluent was treated with ozone nanobubbles while color, BOD, COD, and ozone consumption were tracked.

Color change in secondary piggery wastewater treated with ozone nanobubbles
With Ozone Input Water-Quality Change Confirmed
Piggery wastewater facility, Miryang, Korea
Influent
Secondary piggery wastewater effluent
Flow Rate
65.0 m³/hr
Ozone Generator
300 g/hr
Evaluation
BOD, COD, color, and ozone consumption
Operating Data Ozone consumption tracked by process stage
Water-Quality Indicators Changes in BOD, COD, and color tracked

※ Results and ozone demand vary with influent, pollutant load, reaction time, and operation.

CASE 04

Iron & Manganese Removal by Ozone Oxidation + Filtration

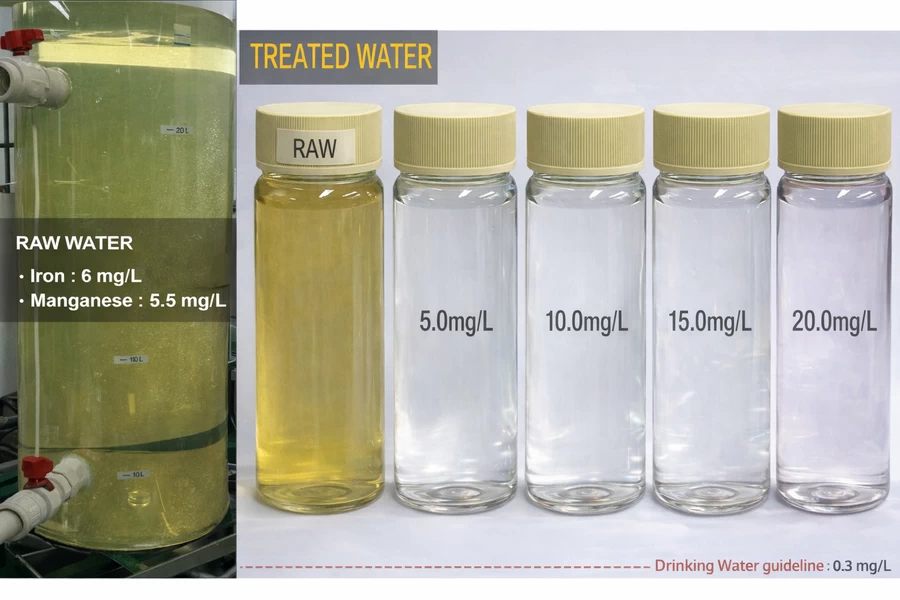
Ozone oxidation plus filtration removed 98%+ of Fe/Mn at 10 mg/L ozone under the tested conditions.

Measured iron and manganese removal using ozone nanobubble oxidation and filtration
Iron & Manganese 98%+ Removal
Ozone nanobubble oxidation + filtration
Source Water
Fe 6 mg/L · Mn 5.5 mg/L
Ozone Dose
5 · 10 · 15 · 20 mg/L (stepwise test)
Key Result
98%+ removal at 10 mg/L ozone
Evaluation
Fe/Mn removal and process configuration
Fe/Mn Removal 98%+
Process Oxidation + filtration combination validated

※ Results may vary with Fe/Mn level, pH, ozone dose, and filtration.