Case Studies · Water Treatment

Water Treatment & Pond Water Quality Cases

Field cases showed higher treated-water DO, COD reduction across existing STP operation, and DO increases in three oxygen-deficient ponds.

CASE 01

Dissolved Oxygen Change in an Existing STP

At a Bengaluru STP, treated-water DO increased during nanobubble-linked operation without replacing the existing process.
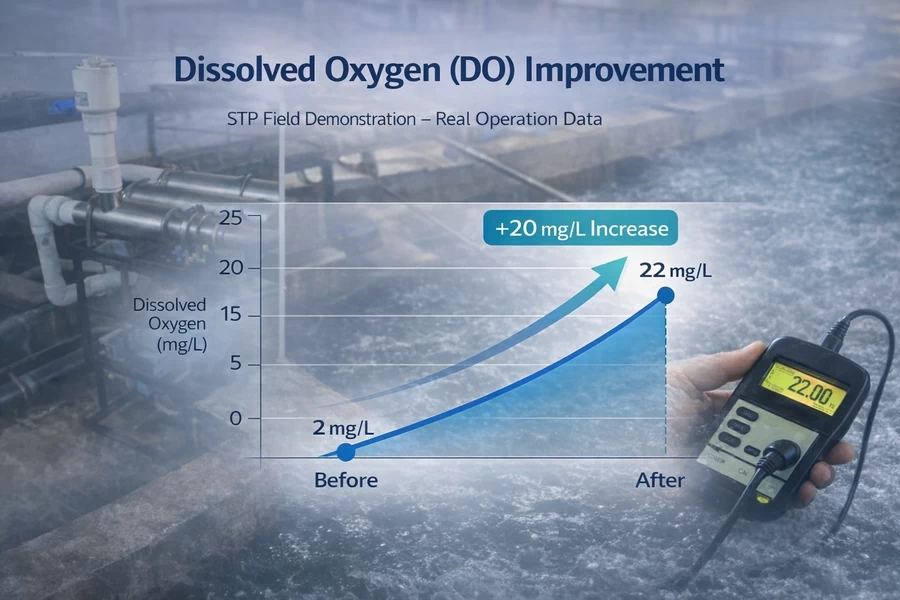
Measured treated-water DO before and after oxygen nanobubble operation at an STP
Treated-Water DO Increase Confirmed
Measured: 2020.02.06 – 2020.02.14
Facility
Private STP, Bengaluru, India
Daily Capacity
300 m³/day
Operation
4.5 hr/day (30 min per hour, daytime)
Evaluation
Change in treated-water DO
DO Change Treated-water DO increased
Operation Mode Integrated with existing STP

※ Results reflect the water quality, temperature, flow, and operating conditions at this facility and may vary by site.
CASE 02

COD Change During Nanobubble-Linked STP Operation

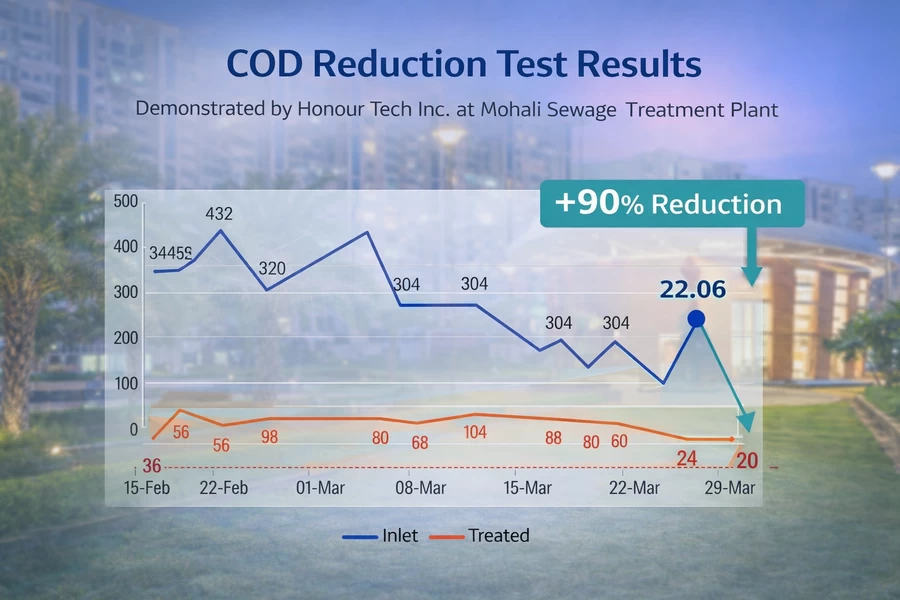
At a Mohali STP, full-process COD reduction was 56–92% during nanobubble-linked operation; influent reached 472 mg/L and treated water fell to 20 mg/L.

Measured COD data during oxygen nanobubble-linked operation at an STP
COD 56~92% Reduction
Measured: 2022.02.14 – 2022.04.10
Facility
Private STP, Mohali, India
Daily Flow
1,250 m³/day
Installation Points
Collection, Filter Feed, Tube Settler Tank
Operation
9 hr/day (daytime)
Evaluation
Effluent COD change
COD Reduction 56~92%
Max. Influent COD 472 mg/L
Lowest Treated COD 20 mg/L

※ Figures are for the full existing STP during linked operation, not the nanobubble system alone; results vary with influent and operation.

CASE 03

Pond DO Change with Oxygen Nanobubbles

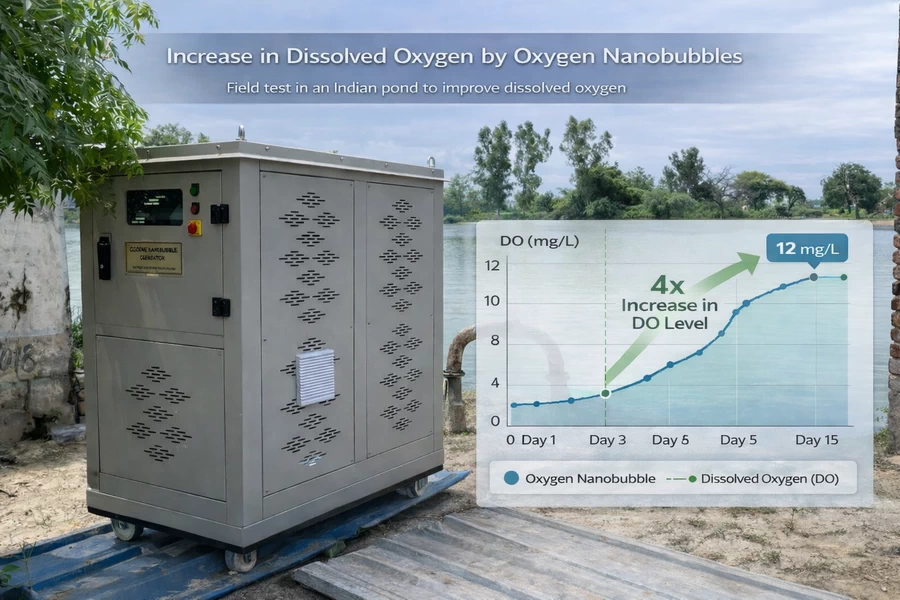
In three Haryana ponds, DO rose from 0.23–1.80 to 8.30–14.32 mg/L. Water-condition changes were also observed at a Korean pond.

Measured pond DO before and after oxygen nanobubble supply
Pond DO Increase Confirmed
India 2022 · Korea 2019
Sites
3 ponds in Haryana, India · Goesan pond, Korea
Evaluation
DO, algae/odor, and water-condition changes
Kanheri 1.50 → 11.80 mg/L
Dangra 0.23 → 8.30 mg/L
Khera 1.80 → 14.32 mg/L
Goesan Pond Water-condition changes observed after 2 months

※ Results vary with water-body size, temperature, depth, pollutant load, and oxygen supply.