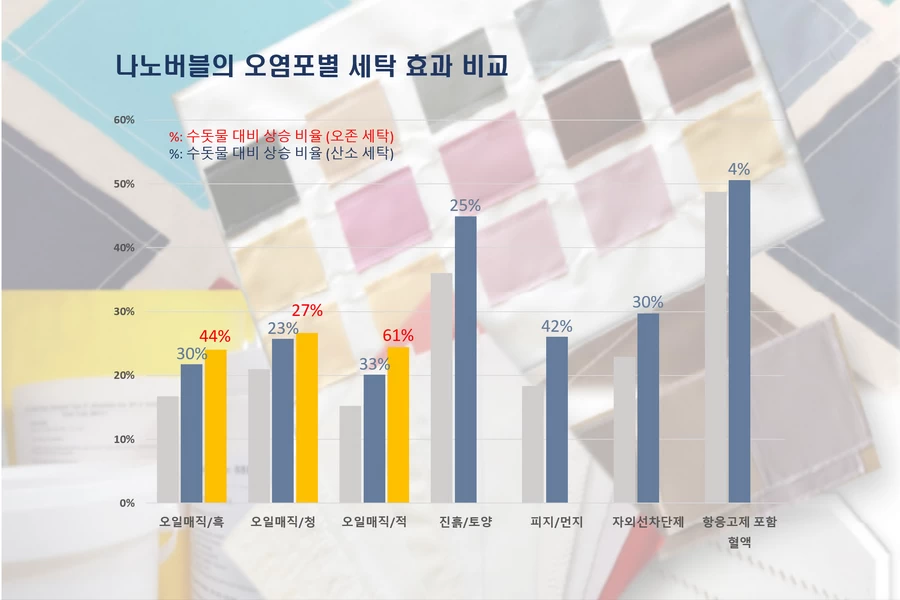
Relative cleaning improvement of +3.7% to +41.3% across 7 soil types
Standard soiled fabrics and oil-based marker fabrics were washed in tap water or oxygen nanobubble wash water, and cleaning rate was compared by measuring color before and after washing.
4 standard soiled fabrics Measurement
- Sebum & dust +42%
- Sunscreen +30%
- Clay & soil +25%
- Blood +4%
Oil-based marker, 3 colors Measurement
- Red +33%
- Black +30%
- Blue +23%
Residual detergent Measurement
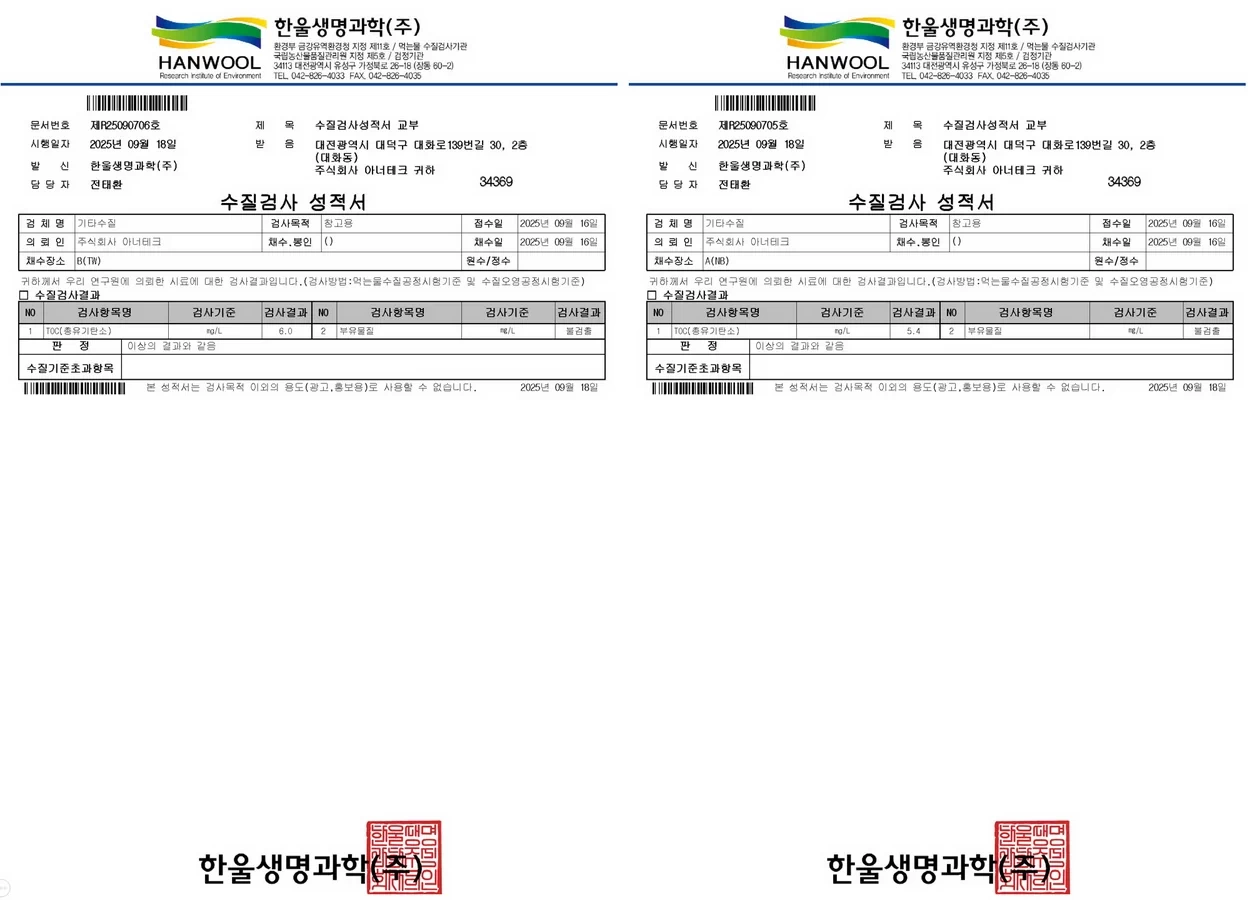
About 10% lowerTOC from washed fabric
Tap water wash 6.0 mg/L, oxygen nanobubble wash 5.4 mg/L
Basis of comparison: tap water wash (same washing machine, detergent and wash cycle) · This was a first test and will be rechecked with repeat tests.
Test conditions, cleaning rate table by fabric, residual detergent analysis and photos
Test conditions
- Target
- Four commercial standard soiled fabrics (clay/soil, sebum/dust, sunscreen, blood) and in-house oil-based marker fabrics in 3 colors
- Test period
- September 2025 (first test)
- Wash conditions
- 7 kg top-loading washer. One wash (13 min, 25.8 L) and three rinses (30.4 L each), 50 min in total
- Detergent
- Commercial liquid detergent, 4 mL (same in all conditions)
- Treatment
- Oxygen nanobubble wash water (dissolved oxygen 55.0 mg/L). Ozone nanobubble wash water was also tested on oil-based marker fabrics
- Control
- Tap water (dissolved oxygen 7.0 mg/L)
- Replicates
- 5 soiled fabric swatches per condition, one wash
- Measurement
- Color before and after washing measured with a colorimeter (D65, 10°) to calculate cleaning rate (CIE Lab color difference)
- Test equipment
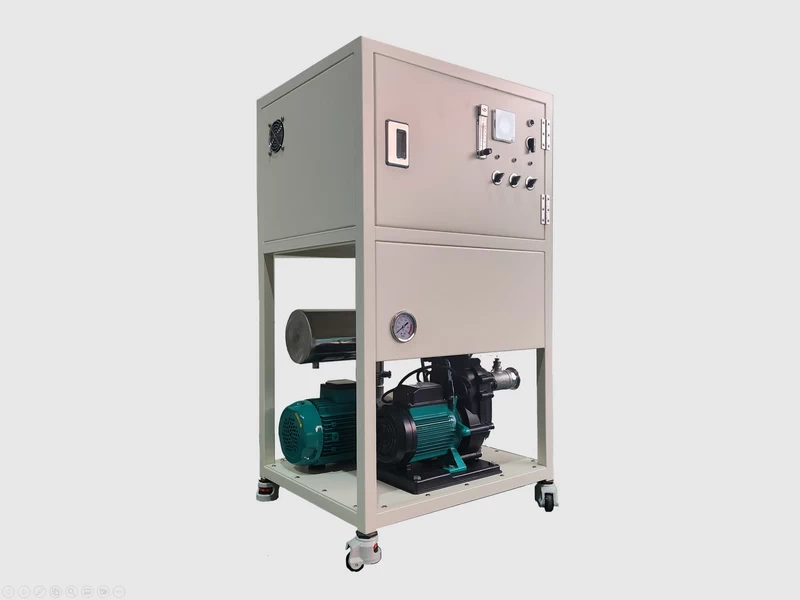
- HQN-001
Cleaning rate for 7 soiled fabrics
Swipe left or right to see the full table.
| Soiled fabric | Improvement (O2 NB) | Tap water (%) | O2 NB (%) | O3 NB (%) | Improvement (O3 NB) |
|---|---|---|---|---|---|
| Oil-based marker (black) | +30% | 16.75 | 21.74 | 24.05 | +44% |
| Oil-based marker (blue) | +23% | 20.94 | 25.78 | 26.66 | +27% |
| Oil-based marker (red) | +33% | 15.20 | 20.15 | 24.43 | +61% |
| Clay & soil | +25% | 36.04 | 44.89 | – | – |
| Sebum & dust | +42% | 18.38 | 26.03 | – | – |
| Sunscreen | +30% | 22.94 | 29.71 | – | – |
| Blood | +4% | 48.78 | 50.57 | – | – |
Improvement is relative to the cleaning rate of the tap water wash (e.g. 16.75% to 21.74% is +30%). Ozone nanobubble wash water was tested only on the oil-based marker fabrics.
Blood soil came out well even with tap water, so the difference was not clear. Measurements were taken with an entry-level colorimeter, and some fabrics became tangled in the laundry net, so the figures will be rechecked with repeat tests.
Photos
Residual detergent
Tap water wash 6.0 mg/L, oxygen nanobubble wash 5.4 mg/L.
Swipe left or right to see the full table.
| Condition | TOC (mg/L) | Vs. reference | Suspended solids (SS) |
|---|---|---|---|
| Diluted detergent (1:1000, reference) | 28.8 | 100% | Not detected |
| Tap water wash | 6.0 | 20.8% | Not detected |
| Oxygen nanobubble wash | 5.4 | 18.8% | Not detected |
1,500 g of cotton laundry was washed with 25.8 mL of detergent (1:1000), air-dried for 24 hours, then soaked in 6 L of ultrapure water for 48 hours, and the total organic carbon (TOC) and suspended solids of that water were analyzed. The analysis was performed by an external laboratory; surfactant components were not analyzed separately.
Photos