Dissolved oxygen in 3 village ponds rose to peaks of 8–14 mg/L
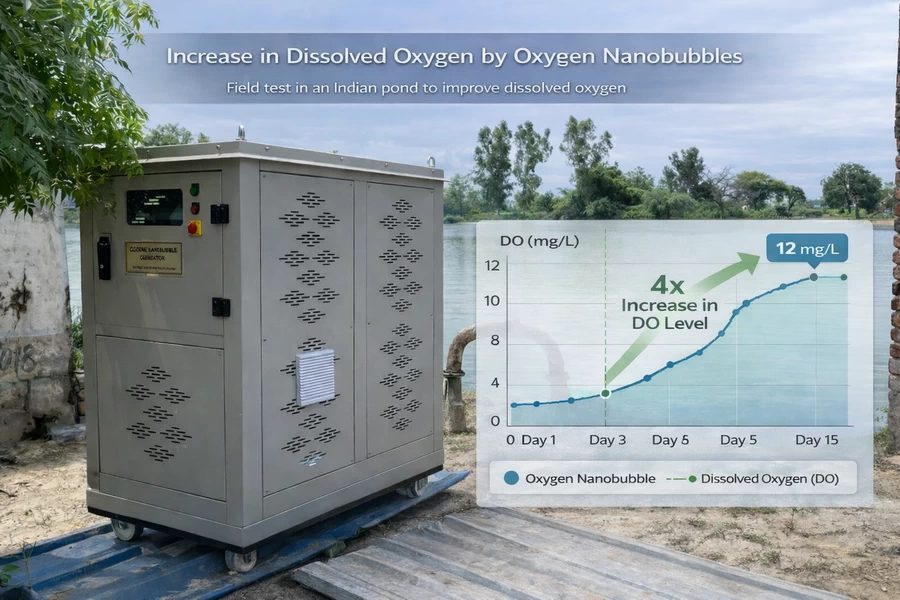
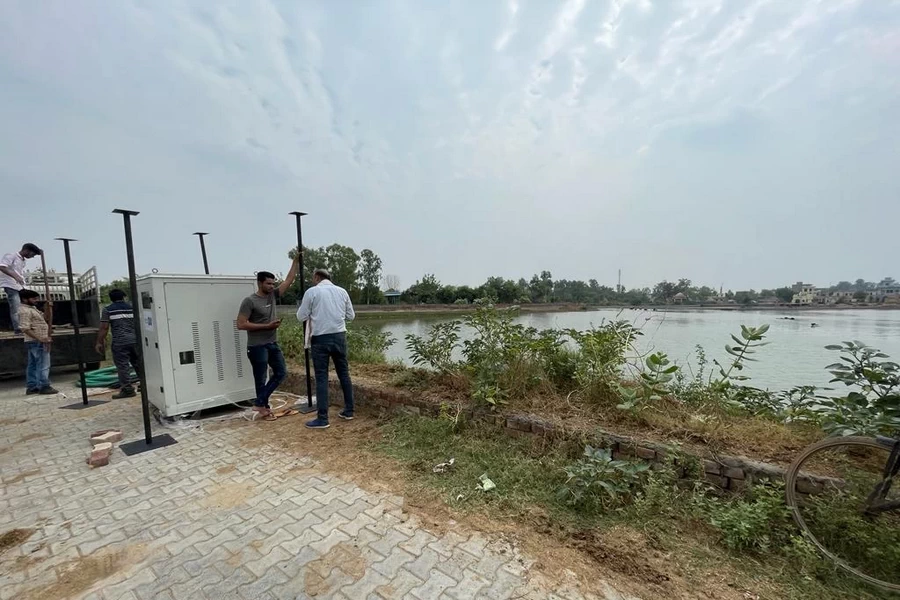
One mobile oxygen nanobubble unit was installed at each of 3 village ponds in India that received household greywater and had almost no oxygen, and dissolved oxygen was measured twice a day.
Loha Khera (mg/L) Measurement
Peak on day 7
Kanheri (mg/L) Measurement
Peak on day 6
Dangra (mg/L) Measurement
Peak on day 9
Basis of comparison: dissolved oxygen before supply · These are peak values during operation, not values that were sustained. Measured by the local partner.
Test conditions, records and progress by pond, photos
Test conditions
- Target
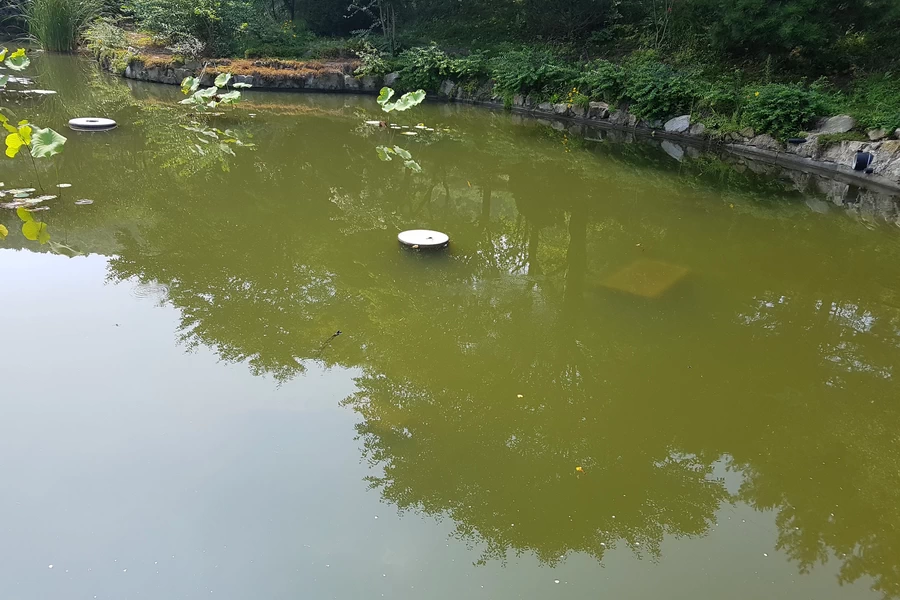
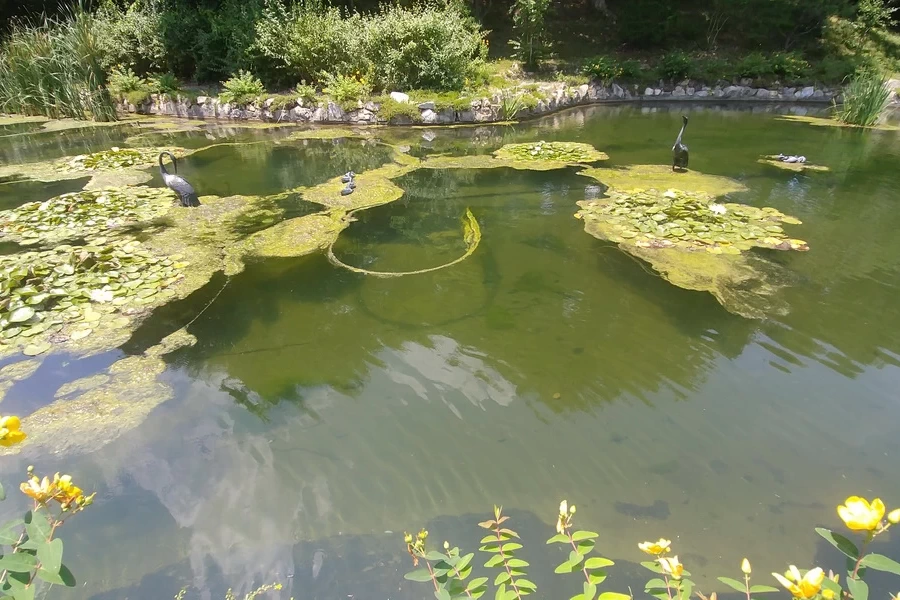
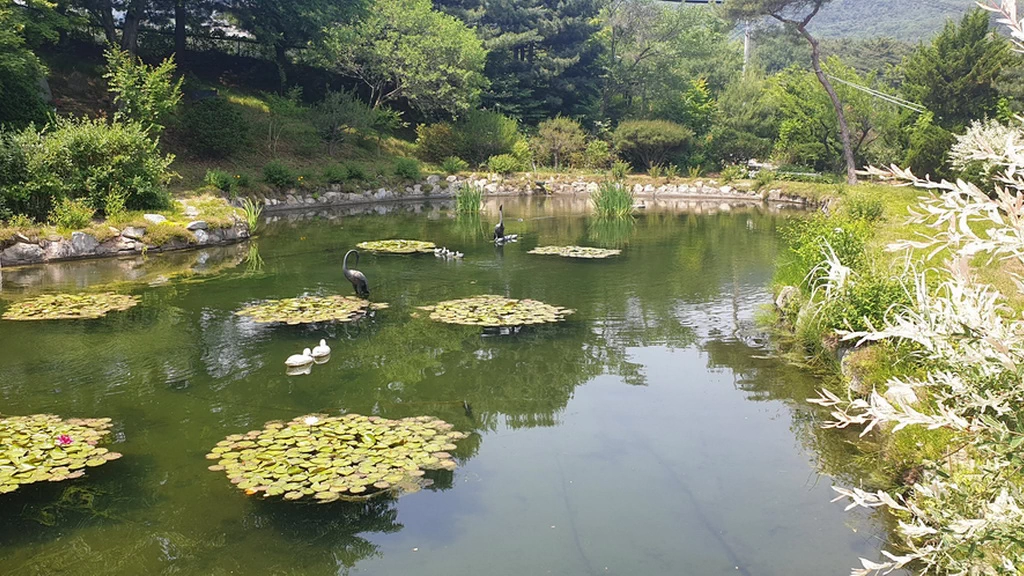
- Three village ponds receiving household graywater (volume 6,306–29,343 m³)
- Location
- Three villages in Haryana, India (Kanheri, Loha Khera, Dangra)
- Period
- June 21 – August 5, 2022, with 9–15 days of records per pond
- Application
- Pond water was drawn off, oxygenated and returned. No civil works or chemicals
- Unit
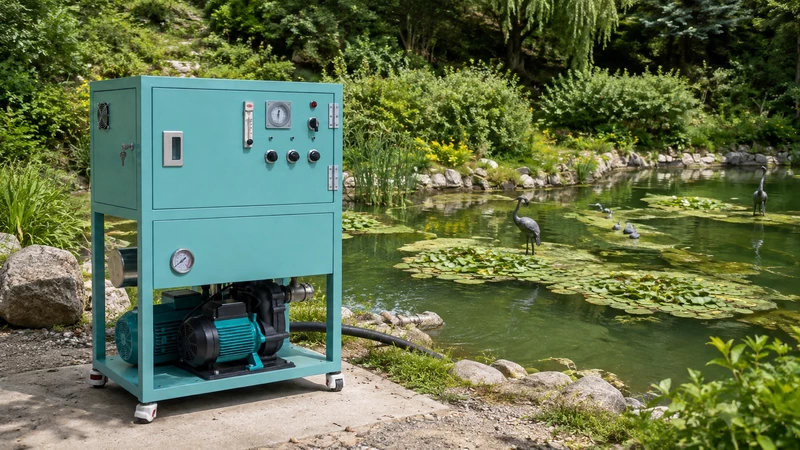
- One unit per pond. Flow 12 m³/h, operating pressure 4.0 bar, oxygen generator (90% purity)
- Operation
- Usually 11–18 hours a day (5 hours on one day)
- Basis of comparison
- Dissolved oxygen before supply
- Measurement
- Portable dissolved oxygen meter, twice a day (morning and evening)
- Conducted by
- State government pilot project for village pond restoration. Operated and measured by the local partner
- Test equipment
- 12 m³/h mobile unit in use at the time
Dissolved oxygen in 3 ponds
Swipe left or right to see the full table.
| Ponds | Peak value (mg/L) |
Before treatment (mg/L) |
After treatment (mg/L) |
Day measured | Surface area (m²) |
Average depth (m) |
|---|---|---|---|---|---|---|
| Loha Khera | 14.32 | 1.80 | 14.32 | Day 7 | 14,313 | 1.6 |
| Kanheri | 11.80 | 1.50 | 11.80 | Day 6 | 36,679 | 0.8 |
| Dangra | 8.30 | 0.23 | 8.30 | Day 9 | 10,510 | 0.6 |
The peak value is the highest value recorded during operation. It does not mean that value was sustained. These are dissolved oxygen concentrations measured by the local partner with a portable meter; measurements of other water quality parameters are not included.
Progress by pond
Rose to 14.32 mg/L on day 7 and stayed above 11 mg/L until the end of records on day 9 (11.70 mg/L). The deepest of the three ponds.
Rose to 11.80 mg/L on day 6. A large inflow of household greywater on days 7–8 brought it down to 2.05 mg/L; it recovered to 7.85 mg/L a day later and stayed above 6 mg/L until day 15 (8.54 mg/L).
Rose to 8.30 mg/L on day 9. Operation on day 4 was limited to 5 hours, and the level fell to 3.40 mg/L on the morning of day 6 before rising again.
Photos