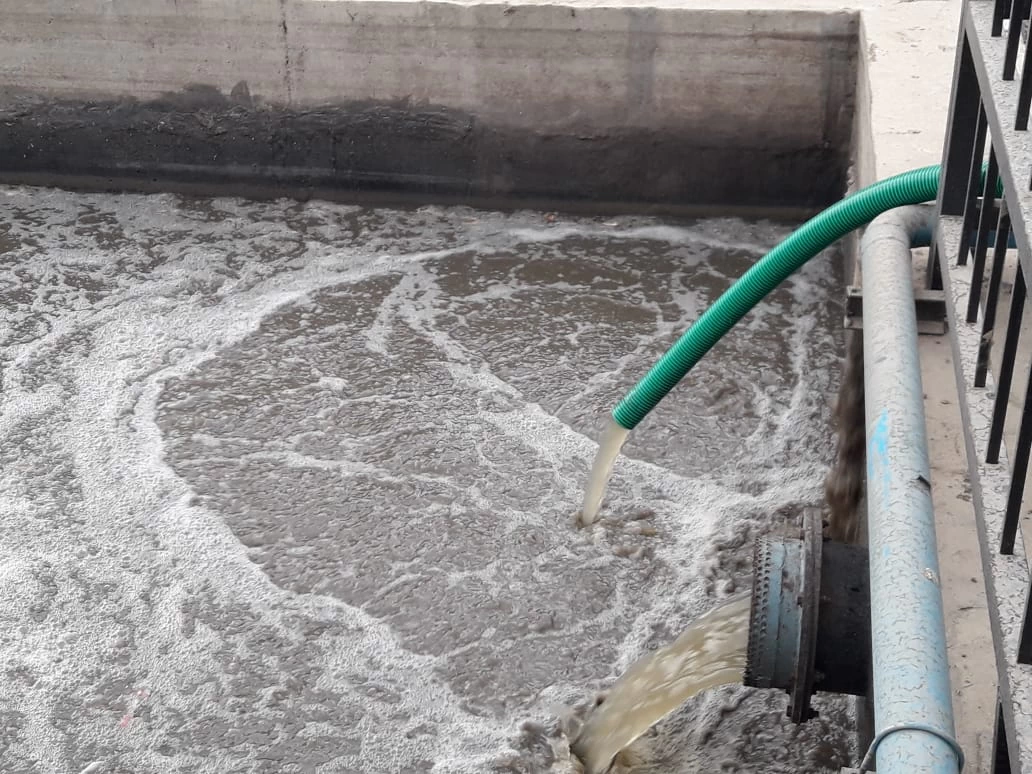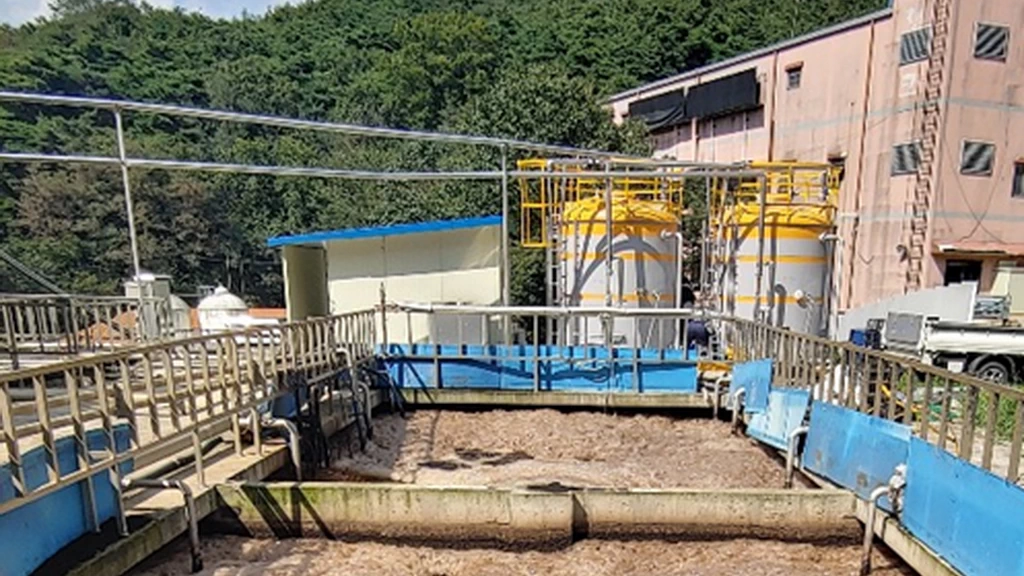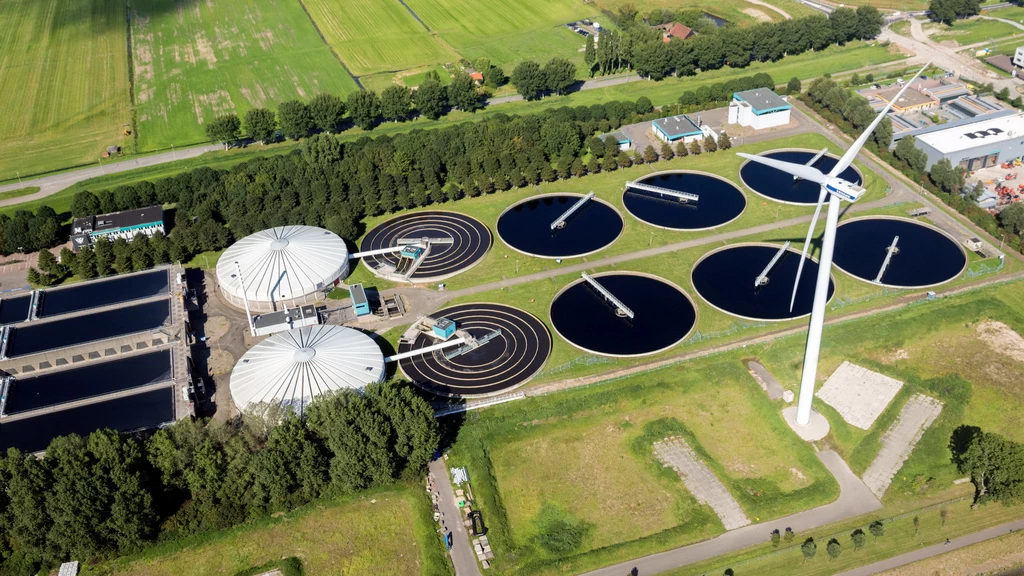
Biological reactor at a sewage treatment plant
Water & Environment · Case Studies

Wastewater treatment & reuse

Changes in organic matter, dissolved oxygen and color when oxygen and ozone nanobubbles are applied to sewage and wastewater treatment.

Key results

56–92%

COD reduction

Private sewage treatment facility in Mohali, India (1,250 m³/day). Result of the whole treatment process operated together with the existing process (Feb–Apr 2022)

Field demonstration Measurement

22.06 mg/L

Treated water dissolved oxygen (0.20 mg/L before supply)

Final storage tank of a residential sewage treatment plant (300 m³/day), Bengaluru, India (February 2020)

Field demonstration Measurement

150 minutes

Time color change was confirmed

7 m³ of secondary treated water at a pig farm, about 300 g/h of ozone (August 2022)

Field demonstration Observation

Field demonstrations, an ozone oxidation test and published research.

  • Car wash wastewater reuse
  • Sewage treatment (STP)
  • Wastewater treatment (WWTP)
  • Industrial wastewater
  • Ozone advanced oxidation (AOP)
Field demonstration
4
In-house test
1
Research cases
4

Results confirmed at treatment sites

Results confirmed while connecting and operating equipment at sewage and wastewater treatment plants.

COD reduction of 56–92% at a sewage treatment plant

Field demonstration

An oxygen nanobubble unit was connected to the existing process of a sewage treatment plant in India whose effluent COD exceeded the standard, and influent and effluent COD were analyzed over two months.

56–92%

COD reduction Measurement

Range for 12 of 14 analyses. The other 2 were 26% and −71%

20 mg/L

Lowest effluent COD Measurement

Standard: below 50 mg/L. 70–90 mg/L before application

Basis of comparison: influent COD on the same day · Results for the whole process operated together with the existing biological treatment, analyzed by a local accredited laboratory.

Test conditions, COD analysis records, operating notes and photos

Test conditions

Target
Private sewage treatment plant (1,250 m³/day, MBBR process)
Location
Mohali, Punjab, India
Period
February 14 – April 16, 2022 (62 days)
Application
Water under treatment is drawn off, oxygen is dissolved into it, and it is returned to the MBBR reactor. Existing equipment left as is
Unit
Nanobubble unit 60 m³/h, oxygen generator 40 L/min
Basis of comparison
Effluent COD before application 70–90 mg/L (limit below 50 mg/L)
Measurement
Influent and effluent COD, analyzed by an accredited local laboratory
Conducted by
Operated and reported by the local partner

COD analysis records

Swipe left or right to see the full table.

Influent and effluent COD analysis records at the sewage treatment plant
Sampling date (2022) Reduction Influent COD (mg/L) Effluent COD (mg/L)
February 15 89.5% 344 36
February 17 72.2% 352 98
February 21 87.0% 432 56
February 25 75.0% 320 80
March 7 83.1% 472 80
March 10 77.6% 304 68
March 15 65.8% 304 104
March 21 56.0% 200 88
March 25 73.7% 304 80
March 29 84.2% 152 24
April 1 91.7% 240 20
April 6 25.7% 280 208
April 13 62.9% 280 104

Only effluent was analyzed on April 14 and 16.

The values for April 6 and 8 depart from the earlier trend. The original report states that around the same time, sugar was dosed into the MBBR reactor, the plant then stopped overnight (April 11–12), and the unit was relocated.

Operating notes

The intake and return points were changed four times during operation. The final operating configuration draws from the filter feed tank and returns to two MBBR reactors.

Photos
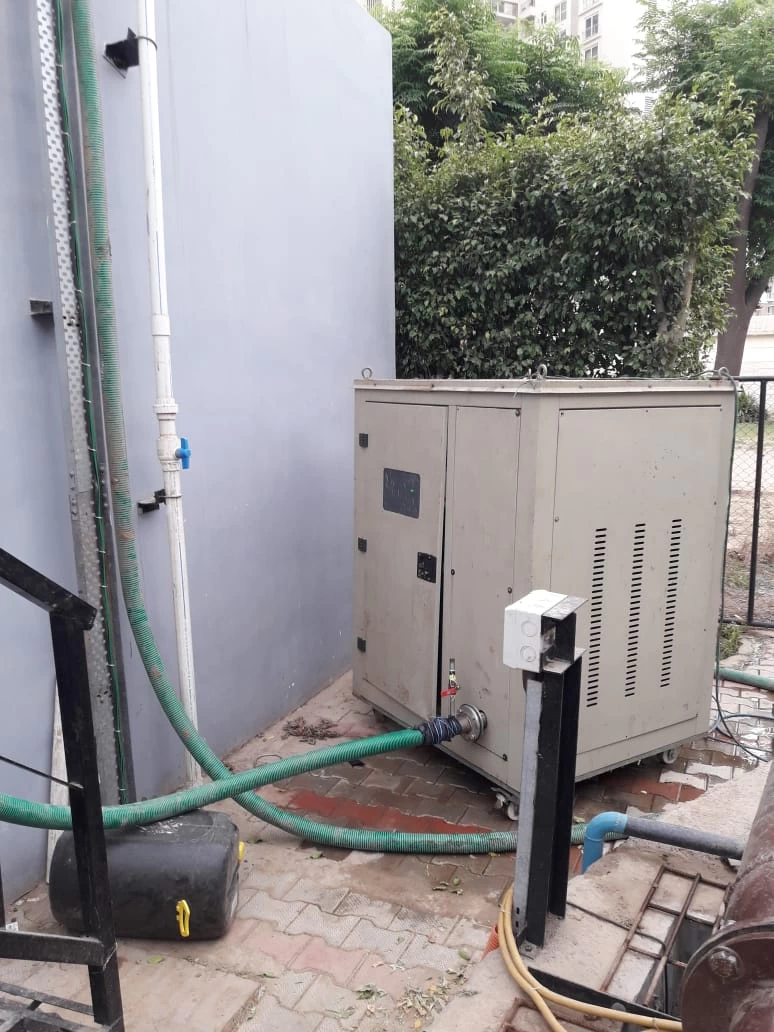
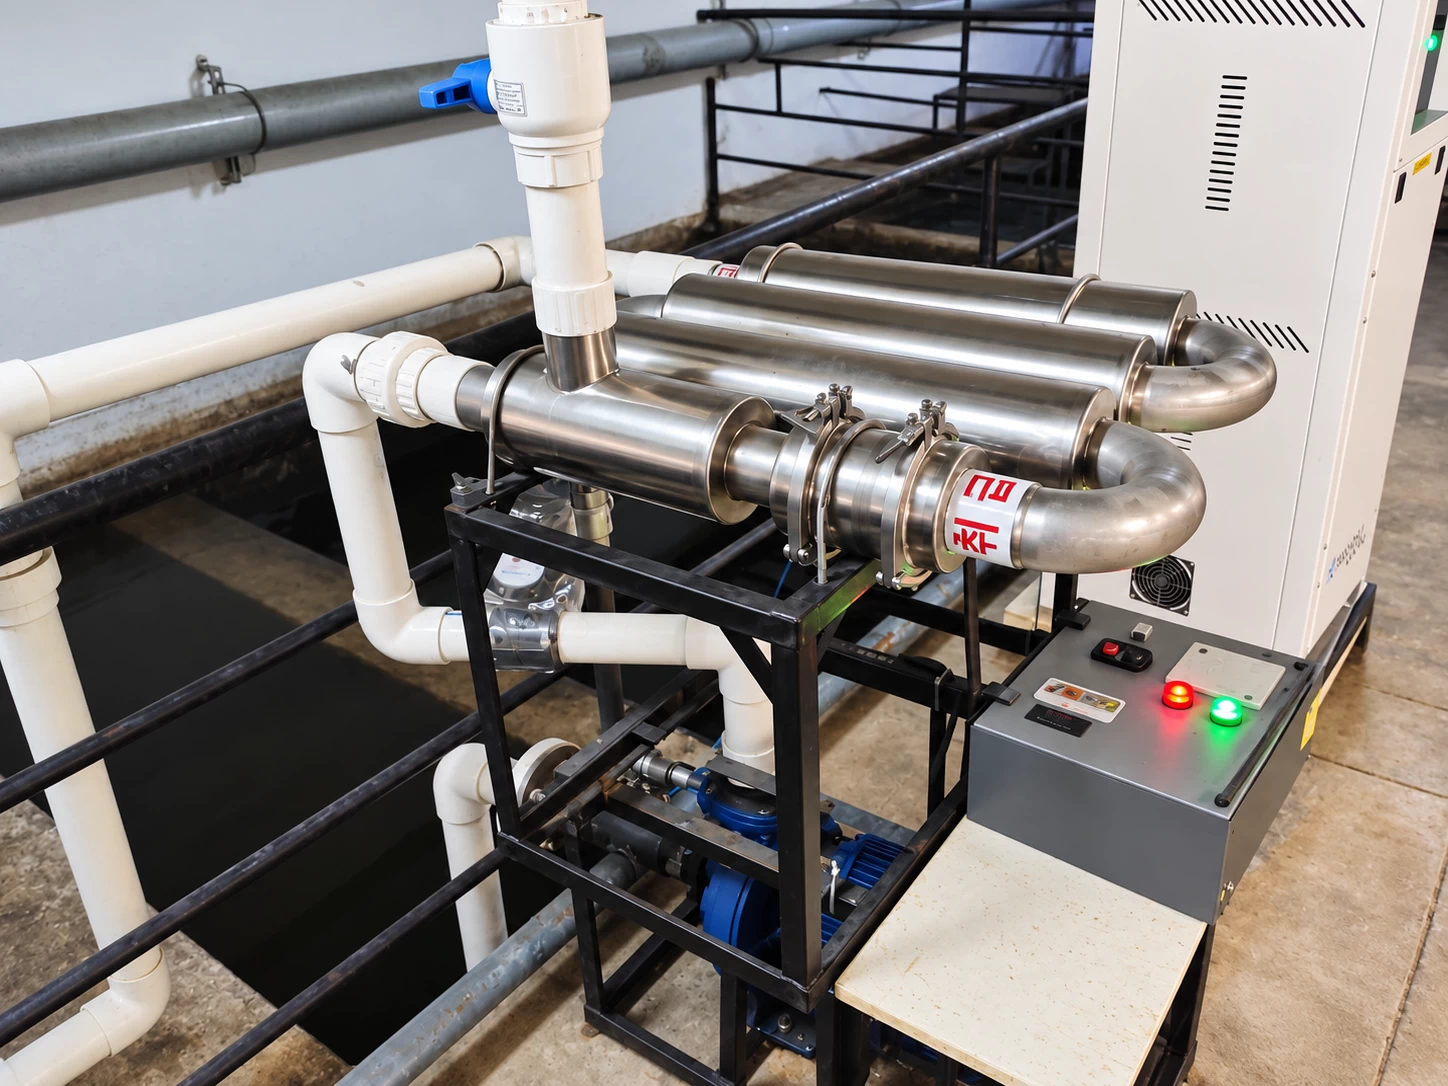
Unit installed at a sewage treatment plant in Mohali

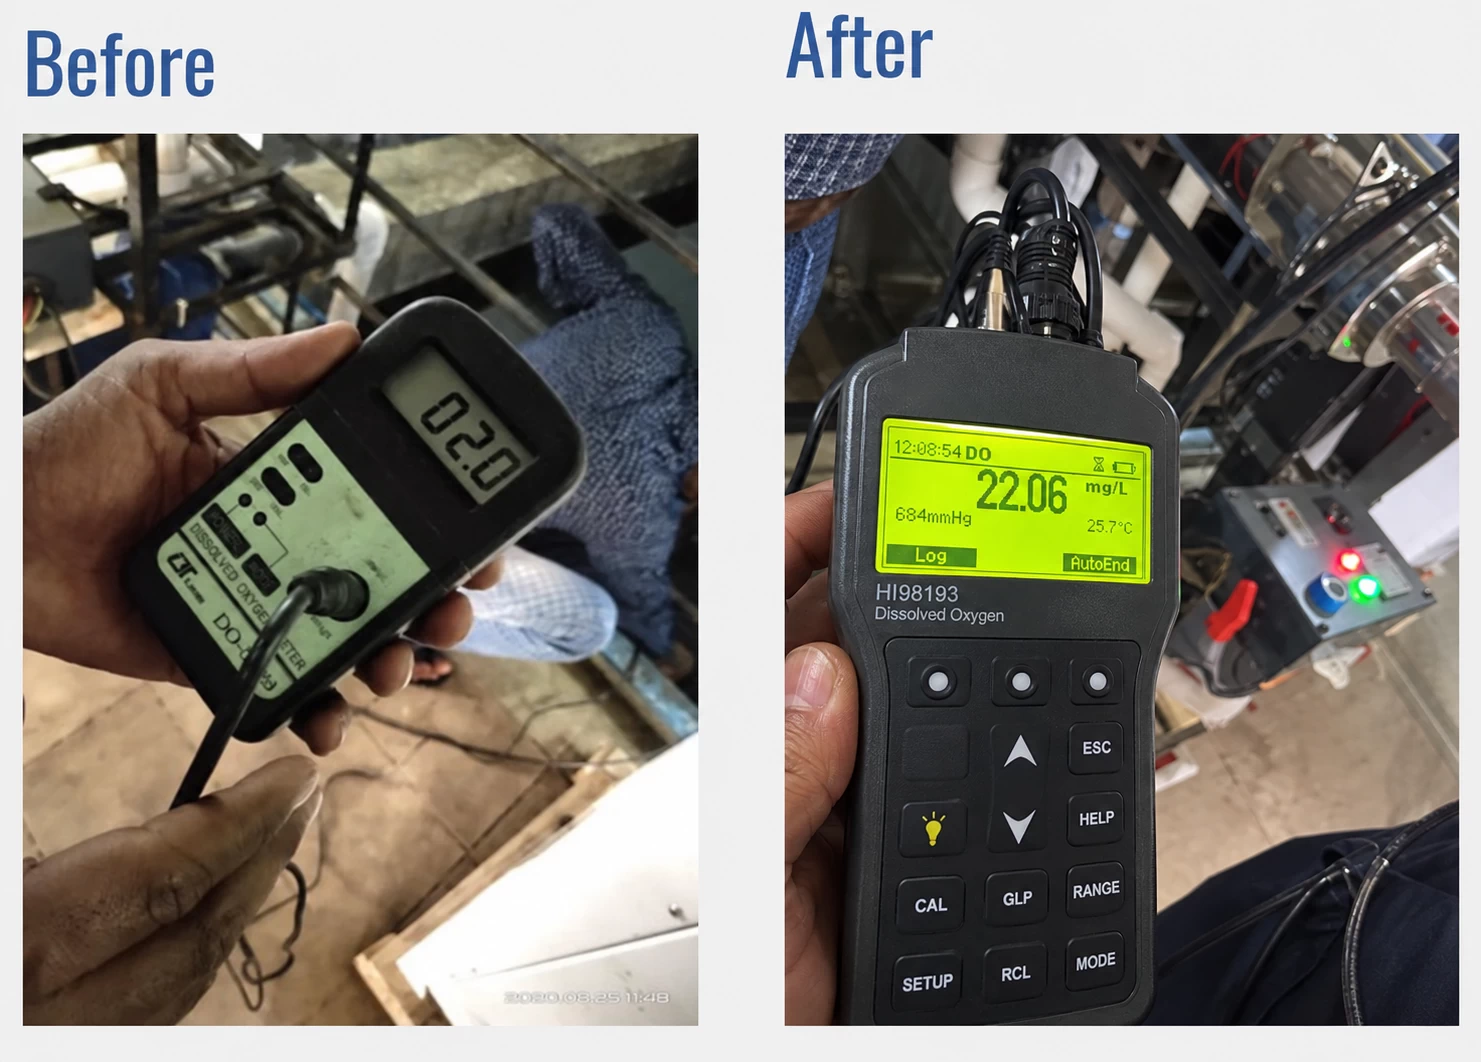
Treated water dissolved oxygen 0.20 → 22.06 mg/L

Field demonstration

An oxygen nanobubble unit was connected to the final storage tank of a residential sewage treatment plant in India that reuses its treated water, and changes in dissolved oxygen were measured.

22.06 mg/L

Final storage tank dissolved oxygen Measurement

0.20 mg/L before supply

Reuse target met Measurement

Exceeded the facility's target (over 15 mg/L). The water is reused for toilet flushing and landscaping.

Basis of comparison: dissolved oxygen before installation · Operated and measured by the local partner.

Test conditions and photos

Test conditions

Target
Treated water from an apartment complex sewage treatment plant (300 m³/day, in its third year of operation)
Location
Bengaluru, India
Period
February 4–16, 2020 (13 days)
Application
Treated water that had passed activated carbon filtration was drawn off, oxygenated and returned to the final storage tank
Unit
Flow 12 m³/h, operating pressure 4.0 bar, oxygen 6.0 L/min (90% purity)
Operation
30 minutes every hour from 08:00 to 17:00
Basis of comparison
Dissolved oxygen before installation
Measurement
Portable dissolved oxygen meter (water temperature 25.7 ℃)
Conducted by
Operated and measured by the local partner

Photos

Installation at the in-house STP of an apartment complex in Bengaluru

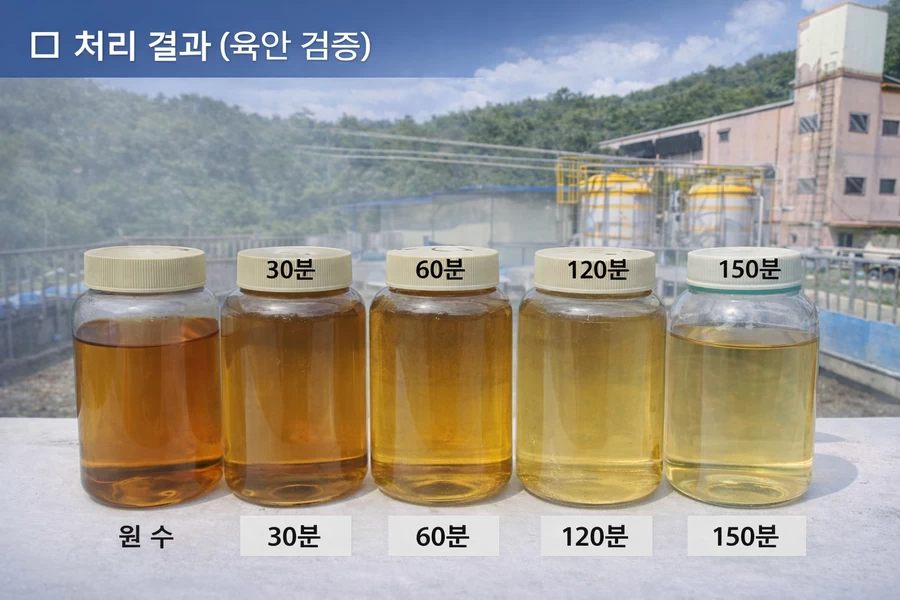
Brown color of livestock wastewater clearly lighter after 150 minutes

Field demonstration

Ozone nanobubbles were applied to pig farm effluent that remained brown after biological treatment, and changes in color and turbidity over time were observed.

30 minutes

Turbidity improved Observation

Cumulative ozone dose 150 g

150 minutes

Color clearly lighter Observation

Cumulative ozone dose 750 g. Began to lighten from 120 minutes

Basis of comparison: raw water before treatment · Collected samples were compared by eye.

Test conditions, observation log by time and photos

Test conditions

Target
Secondary effluent from a pig farm wastewater treatment facility
Location
South Gyeongsang Province
Test date
August 19, 2022
Application
Ozone nanobubble treatment while circulating 7 m³ of effluent
Ozone dose
About 300 g/h (two 200 g/h ozone generators)
Sampling
Every 30 minutes
Evaluation
Visual comparison of color and turbidity of collected samples
Test equipment
Ozone equipment at the time (2 mixers, 2 × 5.5 kW pumps)

Observation log by time

Observations by ozone nanobubble treatment time
Elapsed time Cumulative ozone dose Observation
30 minutes 150 g Turbidity clearly better than raw water. No change in color
60 minutes 300 g Turbidity remained improved. No change in color
90 minutes 450 g No sample taken
120 minutes 600 g Brown color begins to lighten
150 minutes 750 g Color clearly lighter

Ozone dose is calculated from generator output. Beyond 150 minutes was not checked.

Photos

Livestock wastewater test site
Livestock wastewater samples by time (raw, 30, 60, 120 and 150 minutes)

Dyeing wastewater decolorized; efficiency drops above 80 °C

Field demonstration

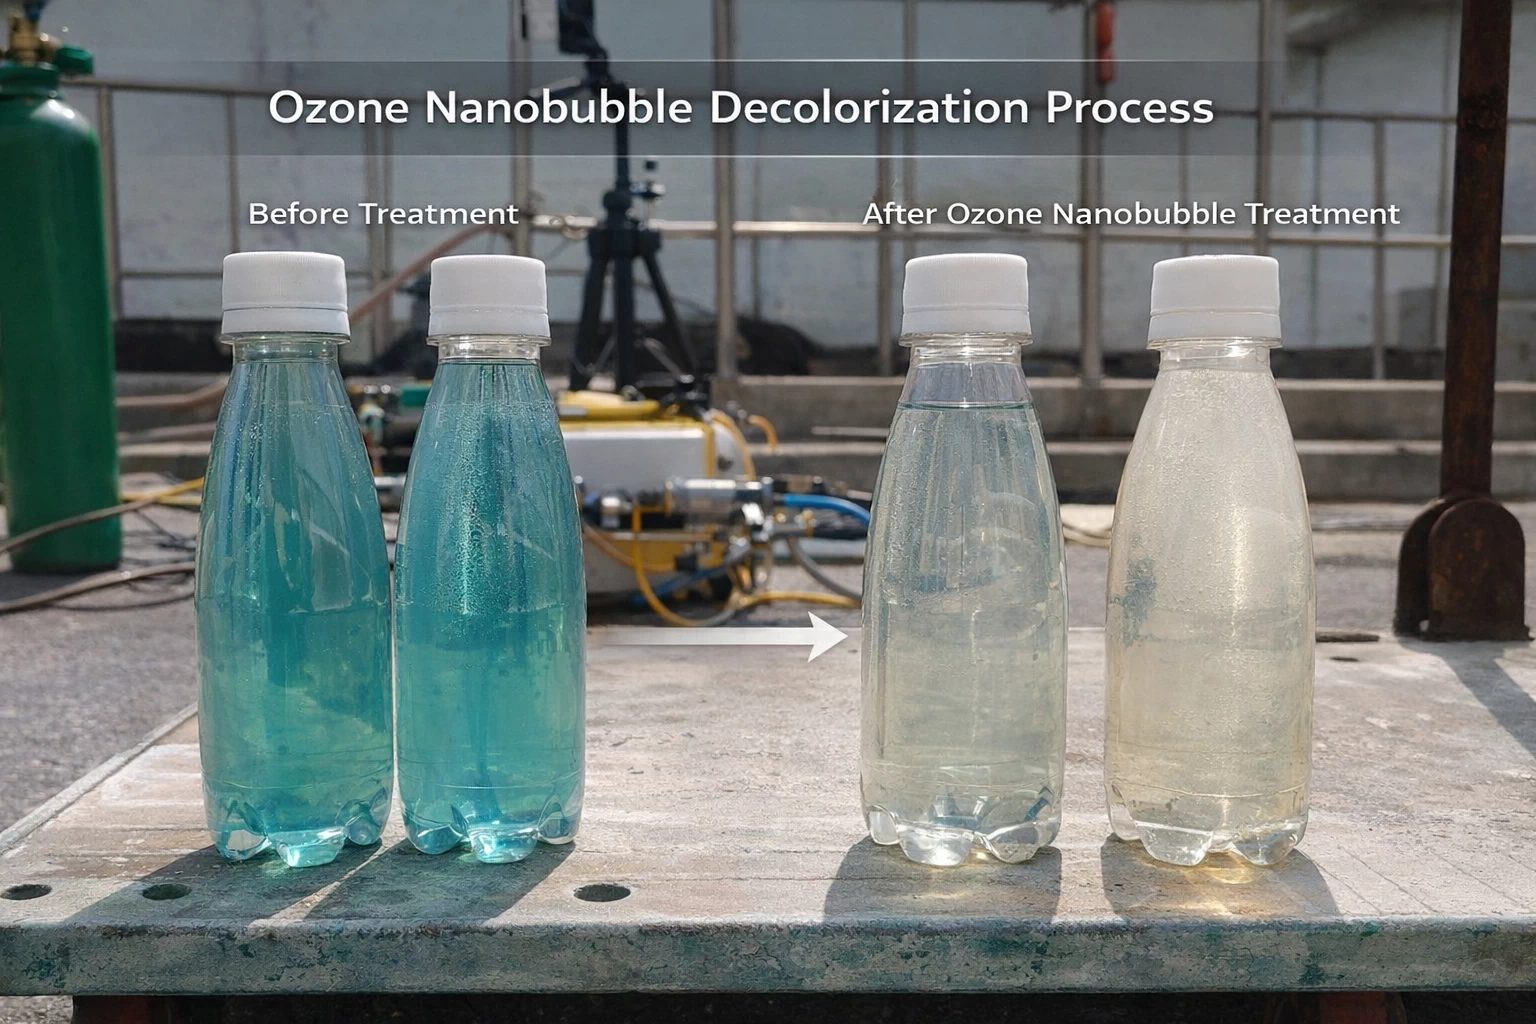
Ozone nanobubbles were applied to wastewater from a dyeing plant, and color changes were observed in two wastewaters at different temperatures.

12 passes

Clear after circulation (about 60 °C) Observation

The yellowish-brown color disappeared.

30 passes

Faint color remained after circulation (above 80 °C) Observation

Up to 10 passes, the blue-green color only lightened slightly.

Basis of comparison: wastewater before treatment · Above 80 °C, nanobubbles did not form well and oxidation efficiency was low, and 0.1 g/min of ozone was not enough to remove all the blue dye.

Test conditions and photos

Test conditions

Target
Dyeing wastewater from a dyeing plant's treatment facility (2 types at different temperatures)
Location
Korea
Test date
May 16, 2022
Application
Ozone nanobubble treatment with the wastewater passed through the unit several times
Unit
Flow 1,500 L/hr, 1 HP pump
Ozone dose
0.1 g/min (20 g/h ozone generator, oxygen 1 L/min)
Evaluation
Visual comparison of color change by number of passes
Test equipment
Small test equipment at the time

Photos

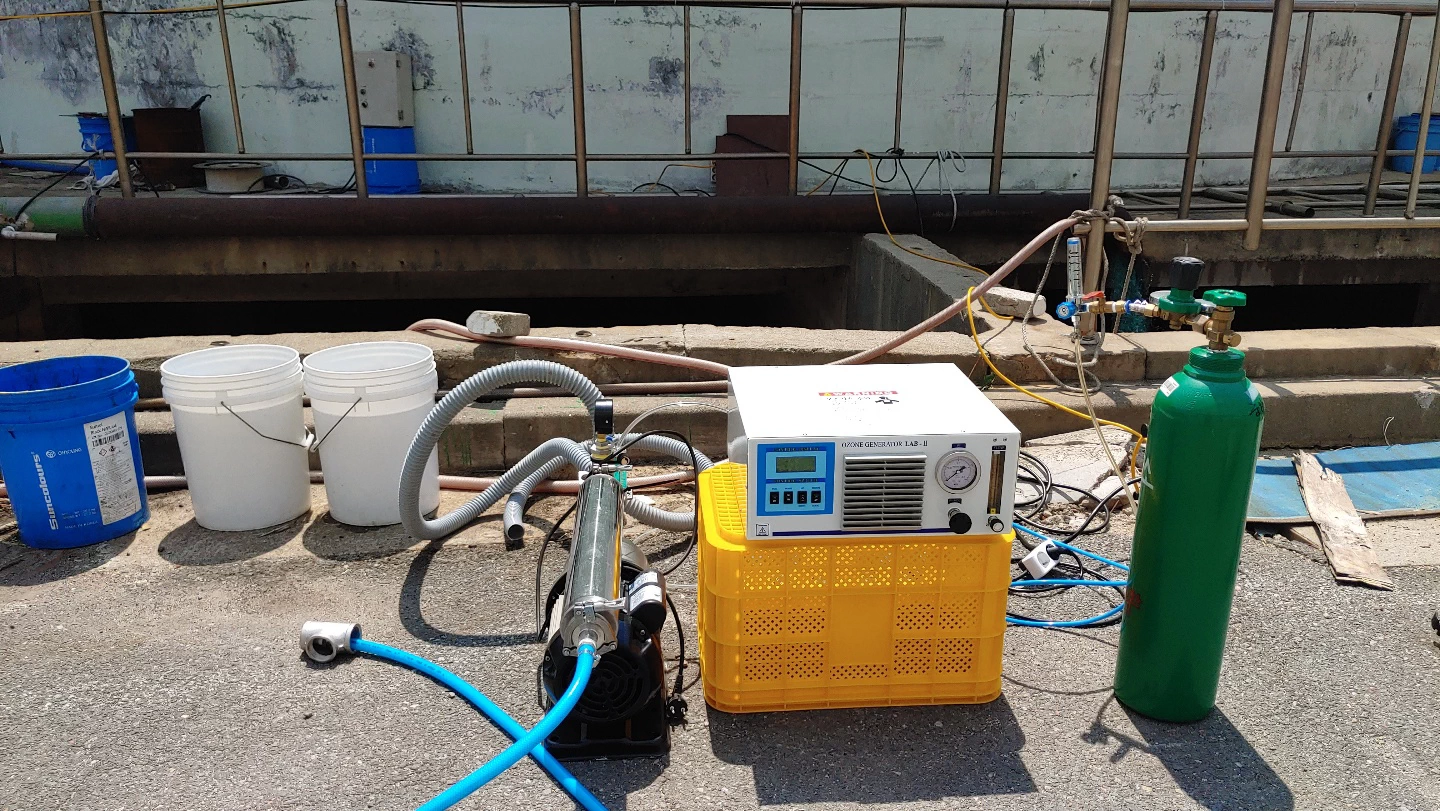
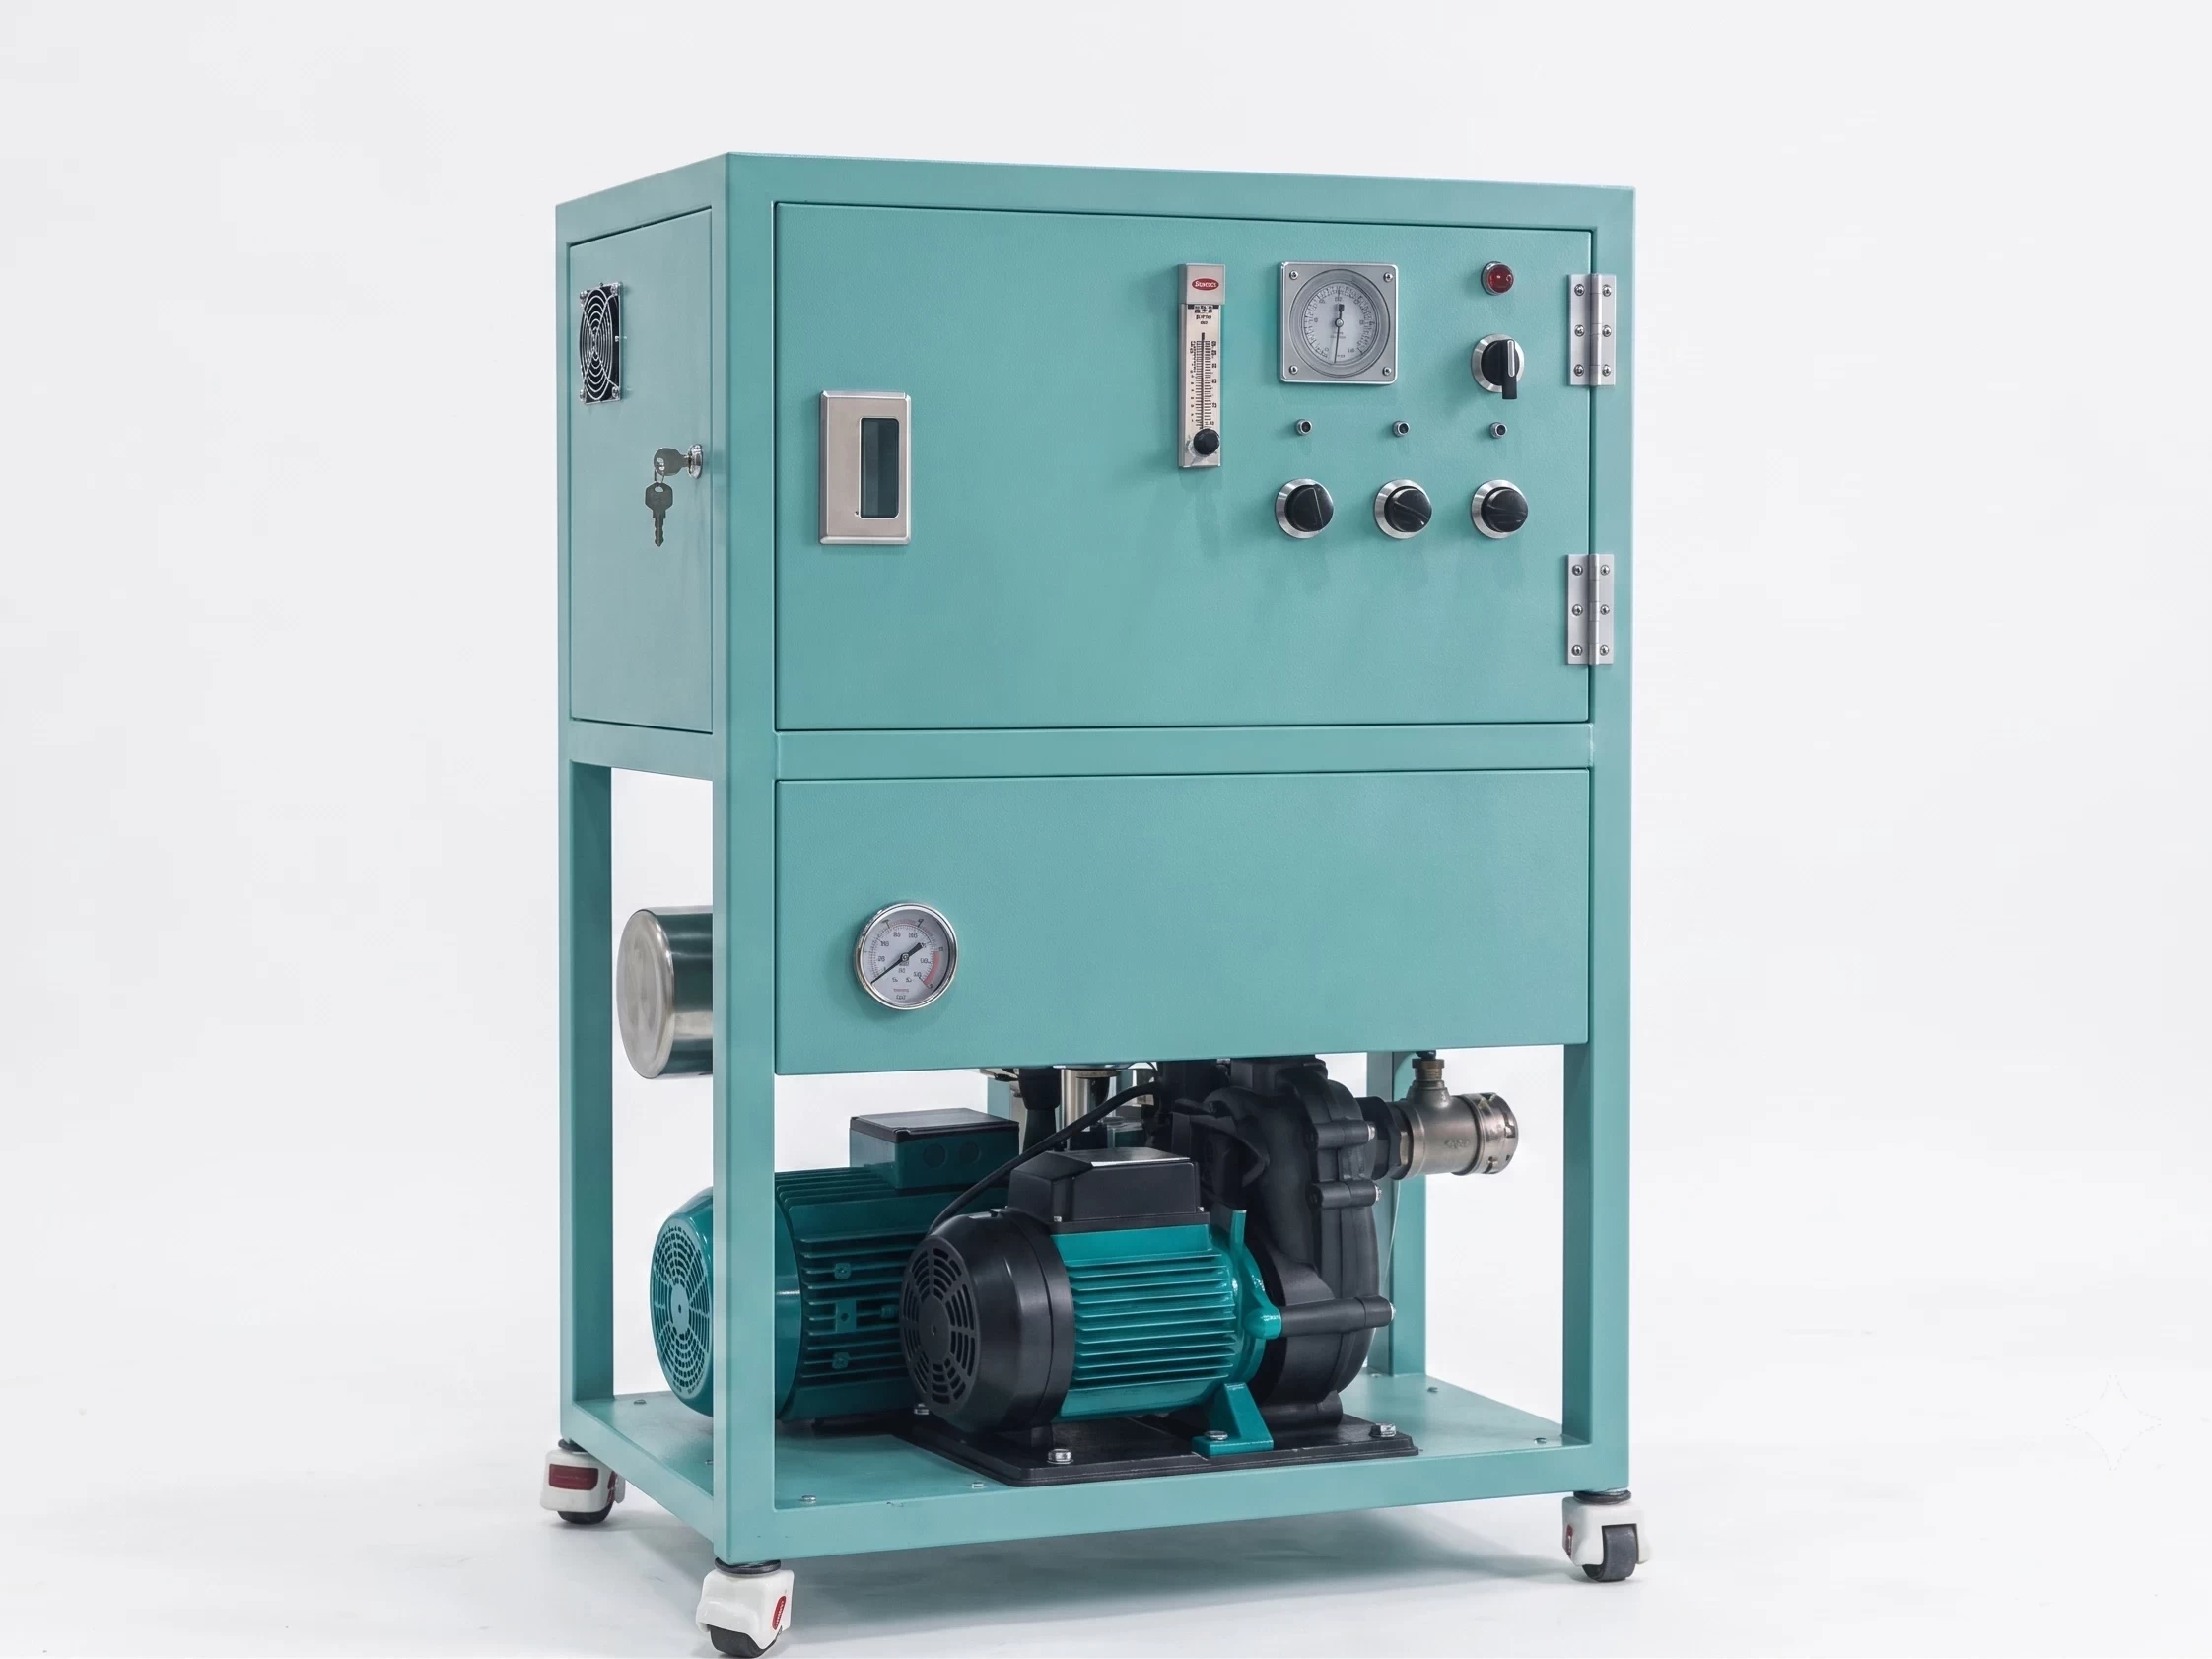
Ozone nanobubble system for field testing
Dyeing wastewater before and after treatment

Basic ozone nanobubble oxidation test

A side-by-side test with tap water to check whether ozone nanobubble water removes the color of organic matter.

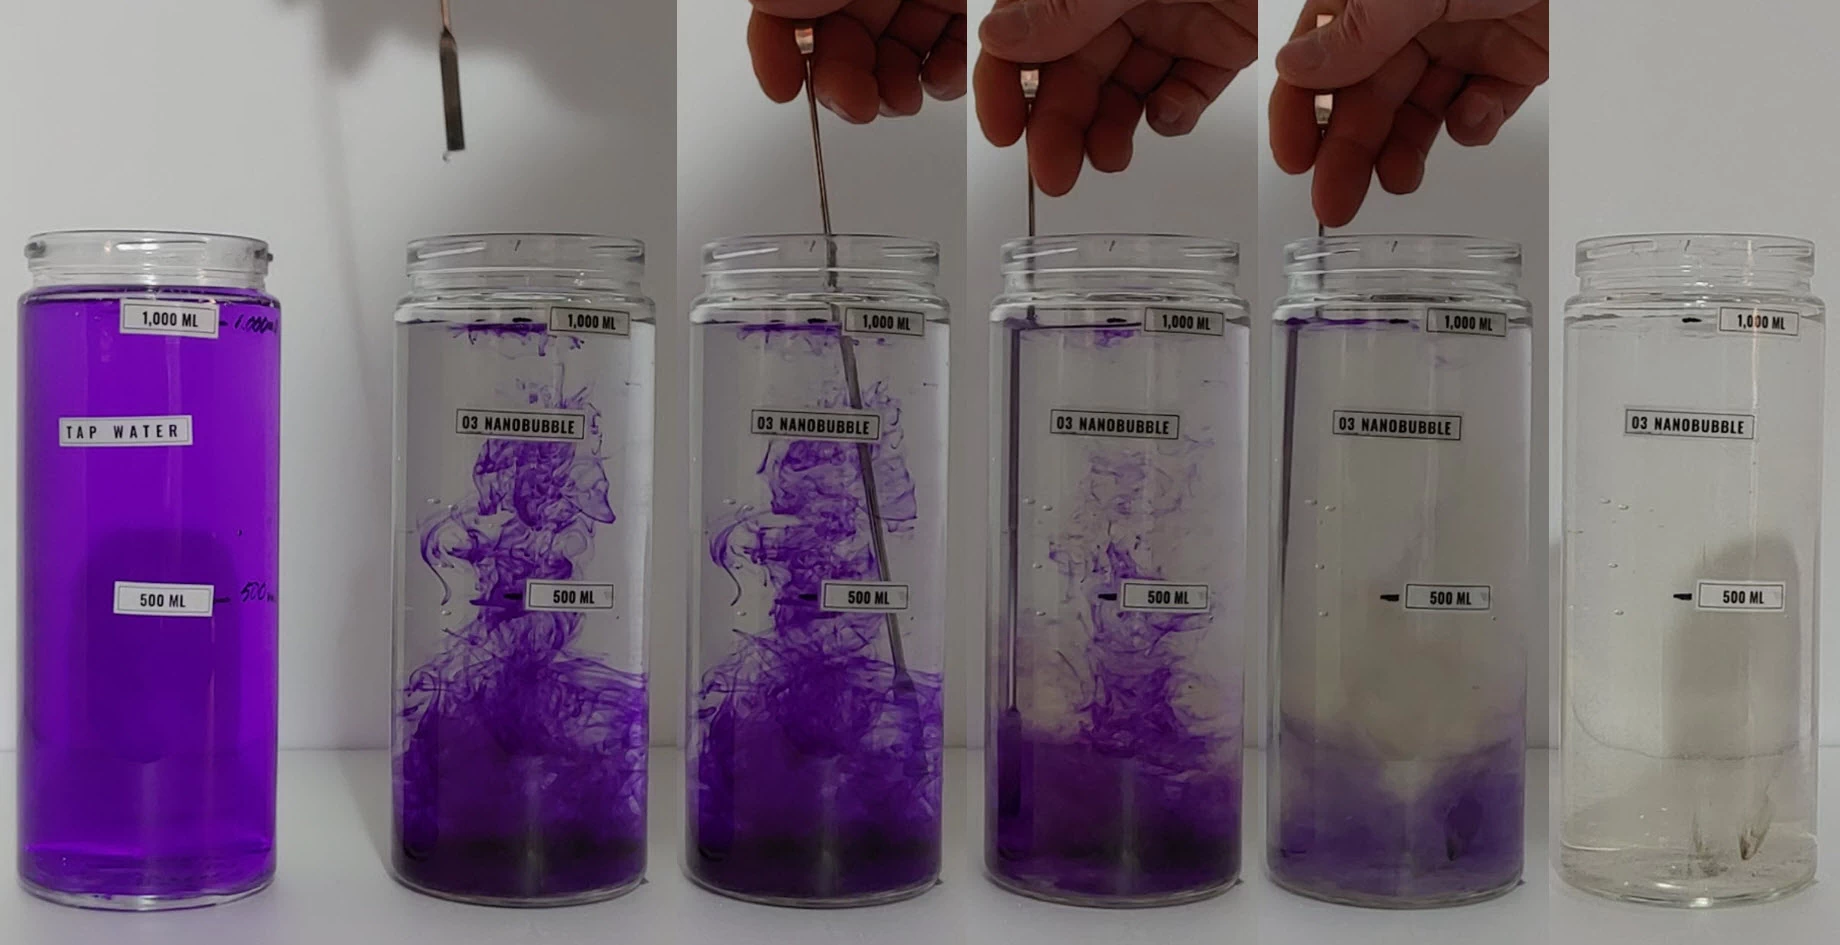
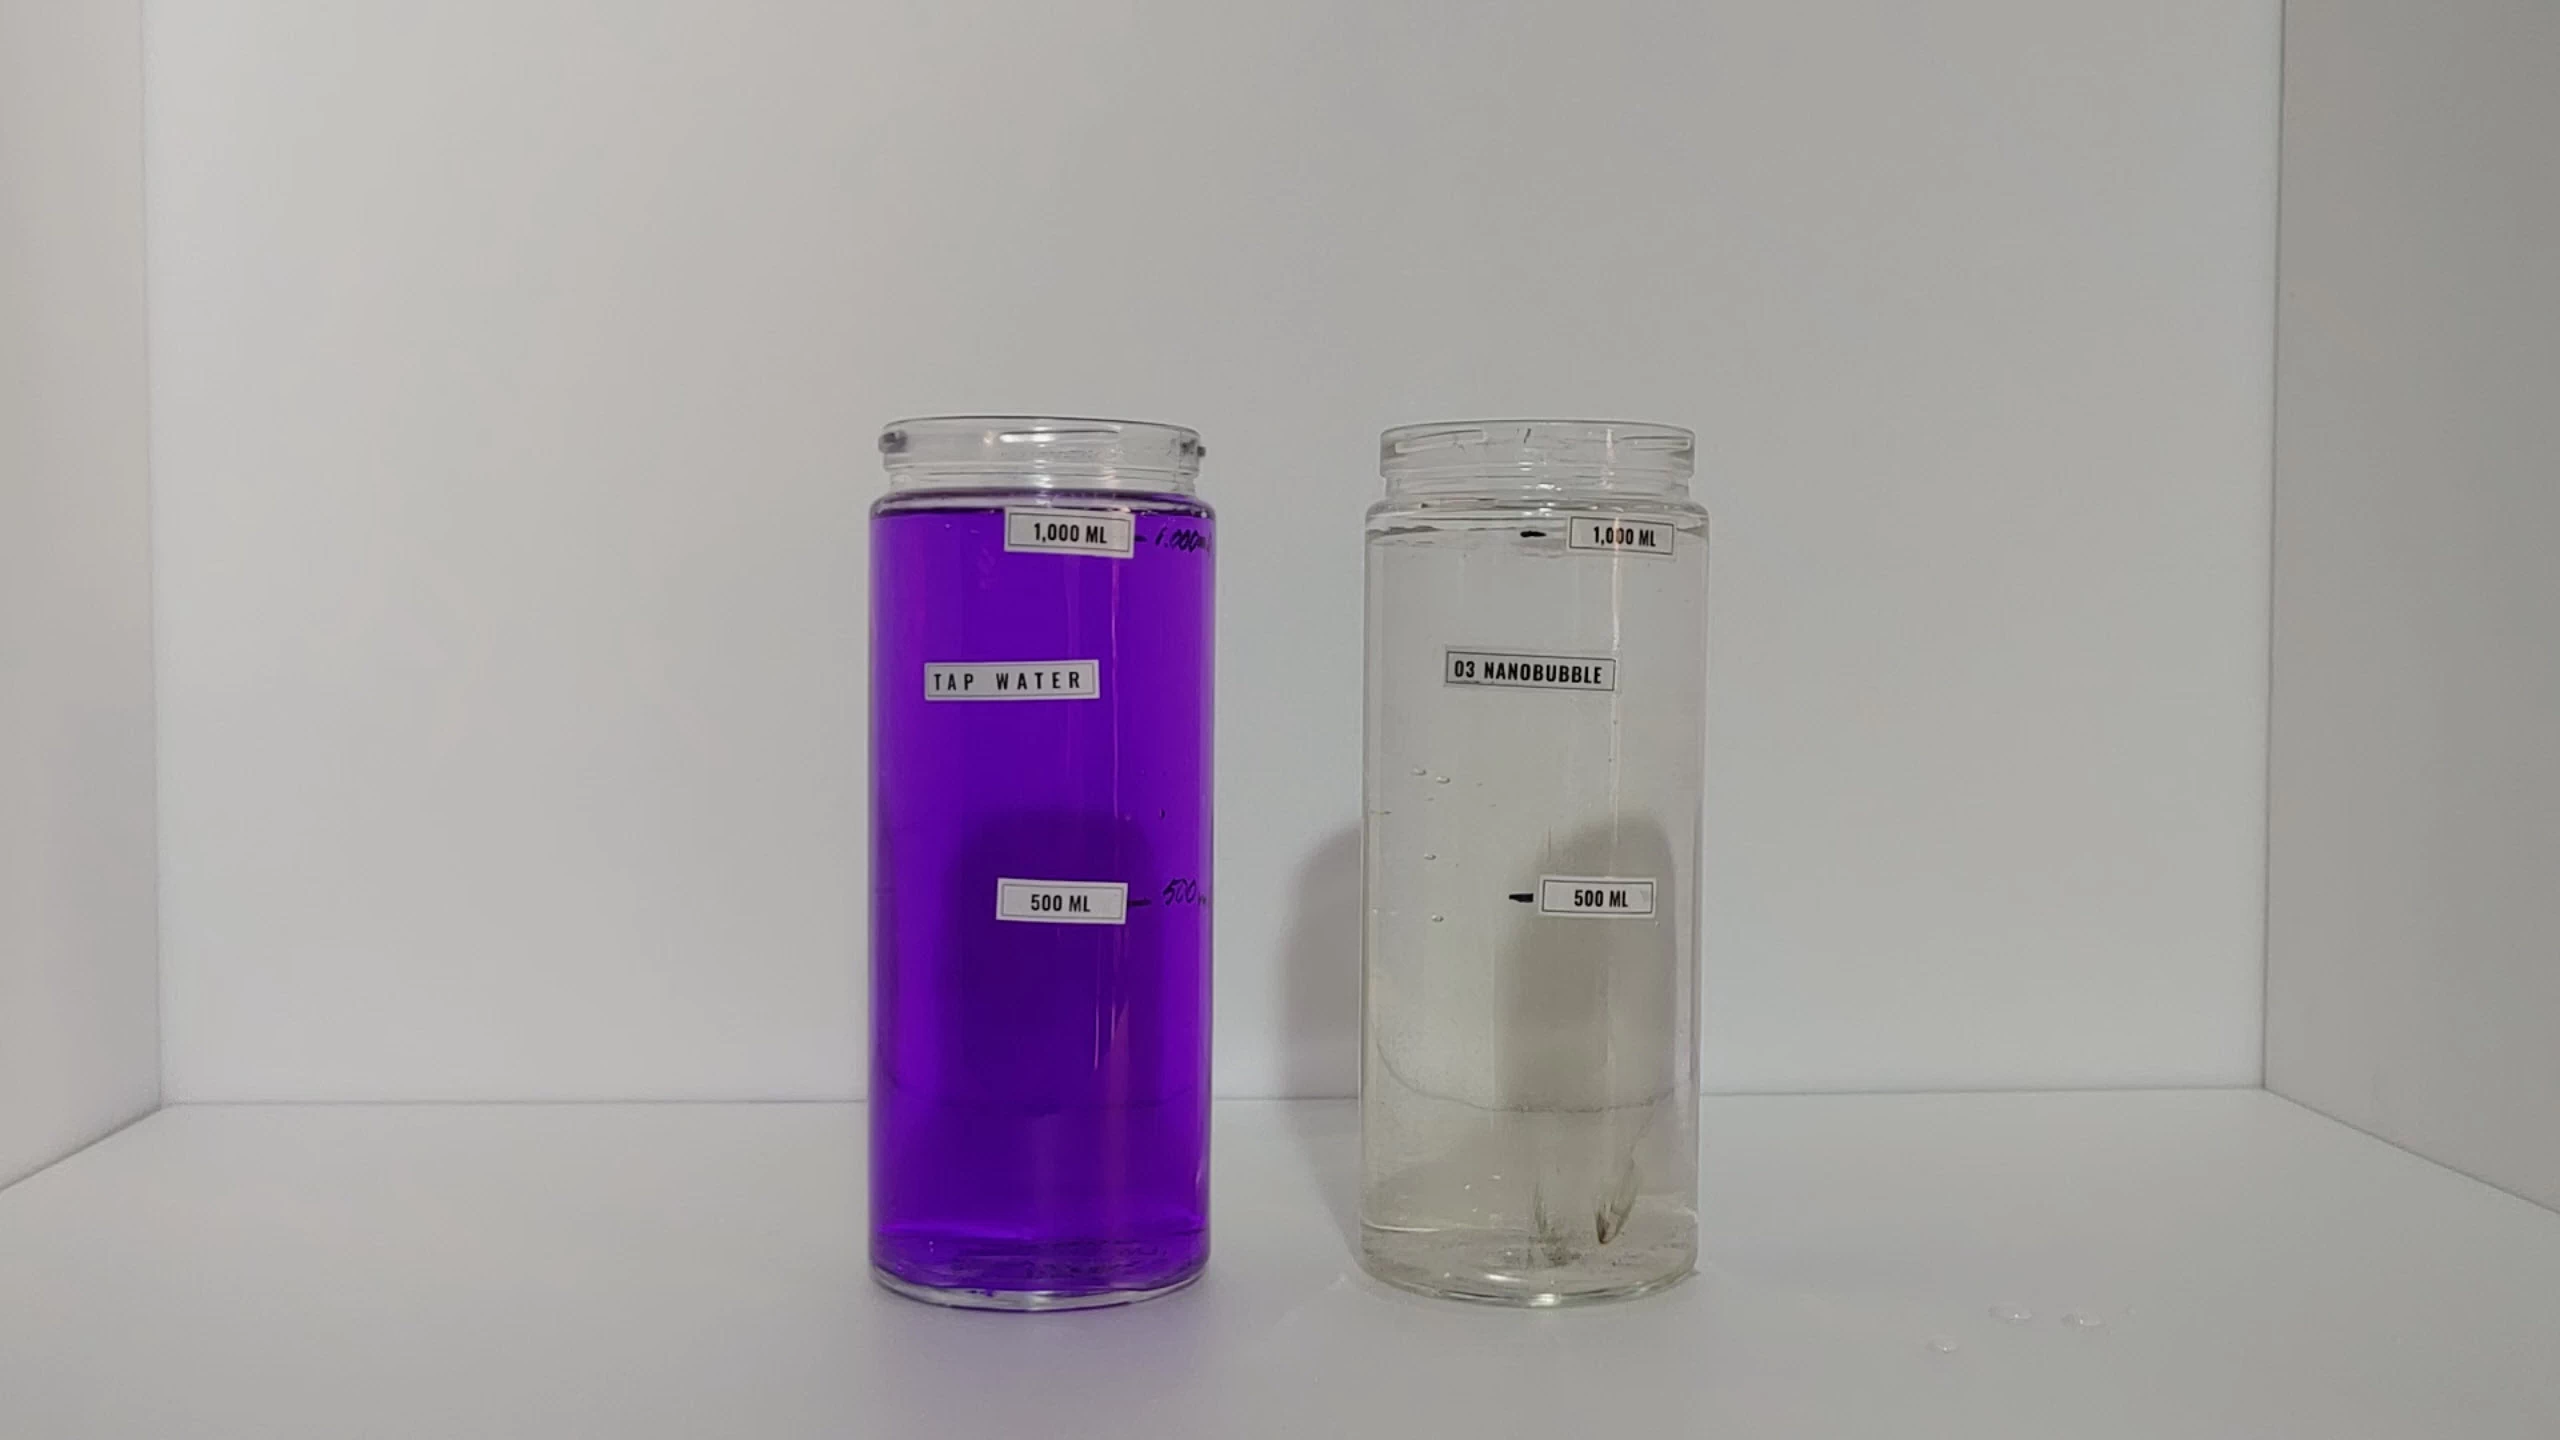
Oil-based ink nearly cleared in ozone nanobubble water

In-house test

The same amount of oil-based stamp ink was dropped simultaneously into tap water and ozone nanobubble water, and the color change was compared.

Ozone nanobubble water Observation

The ink color faded until the water was nearly clear. The way it spread also differed from tap water.

Tap water Observation

The ink color remained until the end of the test.

Basis of comparison: tap water · Dissolved ozone concentration was not measured, so no treatment rate is given.

Test conditions and photos

Test conditions

Target
Oil-based stamp ink
Test date
March 22, 2022 (water temperature 9.0 ℃)
Method
Tap water and ozone nanobubble water in two 1,000 mL containers, with the same amount of ink added at the same time
Ozone nanobubble water
Flow 600 L/hr, oxygen 1 L/min, ozone generator 20 g/hr
Basis of comparison
Tap water
Evaluation
Visual comparison of color change
Test equipment
HQN-001

Photos

Stamp ink in water being oxidized in ozone water
Stamp ink in tap water and ozone water compared

Results reported in published research

These are results from published research, not performance measured with Honour Tech products. We selected representative studies from peer-reviewed papers and public research reports and do not include corporate promotional material. Studies in which the effect was unclear are included as well. Last reviewed: October 2026.

Positive studies 3

  • 96.25%

    Antibiotic removal (120 seconds)

    Ozone micro-nanobubbles. Average TOC removal was 11%.

    96.25% antibiotic removal with ozone micro-nanobubble treatment

    Ozone micro-nanobubbles. Average TOC removal was 11%.

    Paper details and results

    Mechanisms of Enhancing Tetracycline Oxidation in Wastewater by Ozone Micro-Nano Bubbles

    How ozone micro-nanobubbles enhance the oxidation of tetracycline in wastewater

    Citation
    Li et al. · 2026 · Processes 14(7), 1093
    Summary
    Using 5 L of synthetic solution containing tetracycline (40 mg/L), ozone micro-nanobubbles (50–1,200 nm) were compared with conventional ozone diffusion.
    Key findings
    Mean hydroxyl radical concentration was 117% higher than with conventional diffusion, and peak dissolved ozone (27.9 mg/L) 85.5% higher. Total organic carbon (TOC) removal averaged only 11.01%, so the compound was not fully mineralized. Real wastewater was not tested.
    Gas used
    Ozone
    View original (opens in a new window)
  • 95.73%

    Antibiotic removal (45 minutes)

    Vs. 83.85% with ozone microbubbles and 76.75% with conventional ozone diffusion

    95.73% antibiotic removal in an ozone nanobubble process

    Vs. 83.85% with ozone microbubbles and 76.75% with conventional ozone diffusion

    Paper details and results

    Tetracycline degradation for wastewater treatment based on ozone nanobubbles advanced oxidation processes (AOPs) – Focus on nanobubbles formation, degradation kinetics, mechanism and effects of water composition

    Degradation of tetracycline in wastewater by ozone nanobubble advanced oxidation: nanobubble formation, kinetics, mechanisms and effects of water matrix

    Citation
    Koundle et al. · 2024 · Chemical Engineering Journal 501, 156236
    Summary
    Tetracycline dissolved in ultrapure water (100–400 mg/L) was treated with ozone nanobubbles (mean 230–260 nm), ozone microbubbles, conventional ozone diffusion and oxygen microbubbles and compared.
    Key findings
    Mass transfer coefficients were 0.150 for nanobubbles, 0.113 for microbubbles and 0.0085 min⁻¹ for diffusion. Conditions used high concentrations in ultrapure water, and TOC and COD were not measured. Replicates and statistics were not reported.
    Gas used
    Ozone (comparison: oxygen)
    View original (opens in a new window)
  • 82.5%

    Ammonia removal (30 minutes)

    Same ozone flow, vs. 44.2% with conventional bubbles

    82.5% ammonia removal with ozone nanobubble treatment

    Same ozone flow, vs. 44.2% with conventional bubbles

    Paper details and results

    Nanobubble Technology Enhanced Ozonation Process for Ammonia Removal

    Enhanced ammonia removal in ozonation using nanobubble technology

    Citation
    Wu et al. · 2022 · Water 14(12), 1865
    Summary
    Using 10 L of synthetic wastewater high in ammonia, ozone supplied as nanobubbles was compared with ozone supplied through a ceramic diffuser at the same flow rate, in triplicate.
    Key findings
    The reaction rate constant was 0.064 vs. 0.017 min⁻¹ (3.78×), and the proportion of bubbles below 200 nm was 87.1% vs. 33.3%. The water was synthetic, and the generator's energy consumption was not measured.
    Gas used
    Ozone
    View original (opens in a new window)

Neutral studies 1

  • Low efficiency

    Oxygen transfer in wastewater

    Standard oxygen transfer efficiency of about 2–8% in wastewater

    Oxygen transfer efficiency of 2–8% in wastewater for a ceramic membrane nanobubble generator

    Standard oxygen transfer efficiency of about 2–8% in wastewater

    Paper details and results

    Aeration of wastewater with a ceramic membrane nanobubble generator: Experimental validation and modelling of its oxygen transfer

    Wastewater aeration with a ceramic membrane nanobubble generator: experimental validation and modeling of oxygen transfer

    Citation
    Messina, Christensen · 2025 · Chemical Engineering Journal 524, 169390
    Summary
    Demineralized water, buffer solution and activated sludge from a sewage treatment plant were aerated with a ceramic membrane nanobubble generator, and oxygen transfer was measured and compared with a model. This was a short-term test in a 10 L laboratory unit.
    Key findings
    Standard oxygen transfer efficiency was about 20–54% in demineralized water and about 2–8% in wastewater, and standard aeration efficiency was below 0.01 kg O₂/kWh. The authors concluded that nanobubbles are not the main carrier of oxygen and that oxygen transfer comes mainly from microbubbles and turbulence.
    Gas used
    Air
    View original (opens in a new window)

Frequently Asked Questions

Do existing sewage treatment facilities need to be replaced?

At the demonstration sites, the unit was connected while existing equipment was left as is.

Water under treatment is drawn in, oxygen is dissolved into it, and it is returned to the reactor or storage tank. The 56–92% COD reduction is the result of the whole process operated together with the existing biological treatment, not the contribution of the nanobubble unit alone.

In which wastewaters was a color change confirmed?

In livestock wastewater and dyeing wastewater.

The pig farm's treated water became clearly lighter after 150 minutes of ozone dosing, and dyeing wastewater at about 60 °C became clear after 12 passes. These are visual comparisons of color change; for wastewater above 80 °C, efficiency was low, so applying treatment after lowering the temperature should be considered.

Are there data on car wash wastewater reuse?

The system was commercialized in 2023, and field figures are being compiled.

This configuration treats car wash wastewater with ozone nanobubbles and reuses it as wash water. Figures will be published on this page once conditions have been documented.

How were the studies selected?

We selected representative studies from peer-reviewed published papers.

We include 3 positive studies and 1 study with limited effect. These are not performance measurements of Honour Tech products, and many are laboratory studies using synthetic wastewater or ultrapure water.

Tell us the type and quality of the wastewater, treatment flow rate, existing process and target water quality, and we will review how to apply the technology.

Contact Us