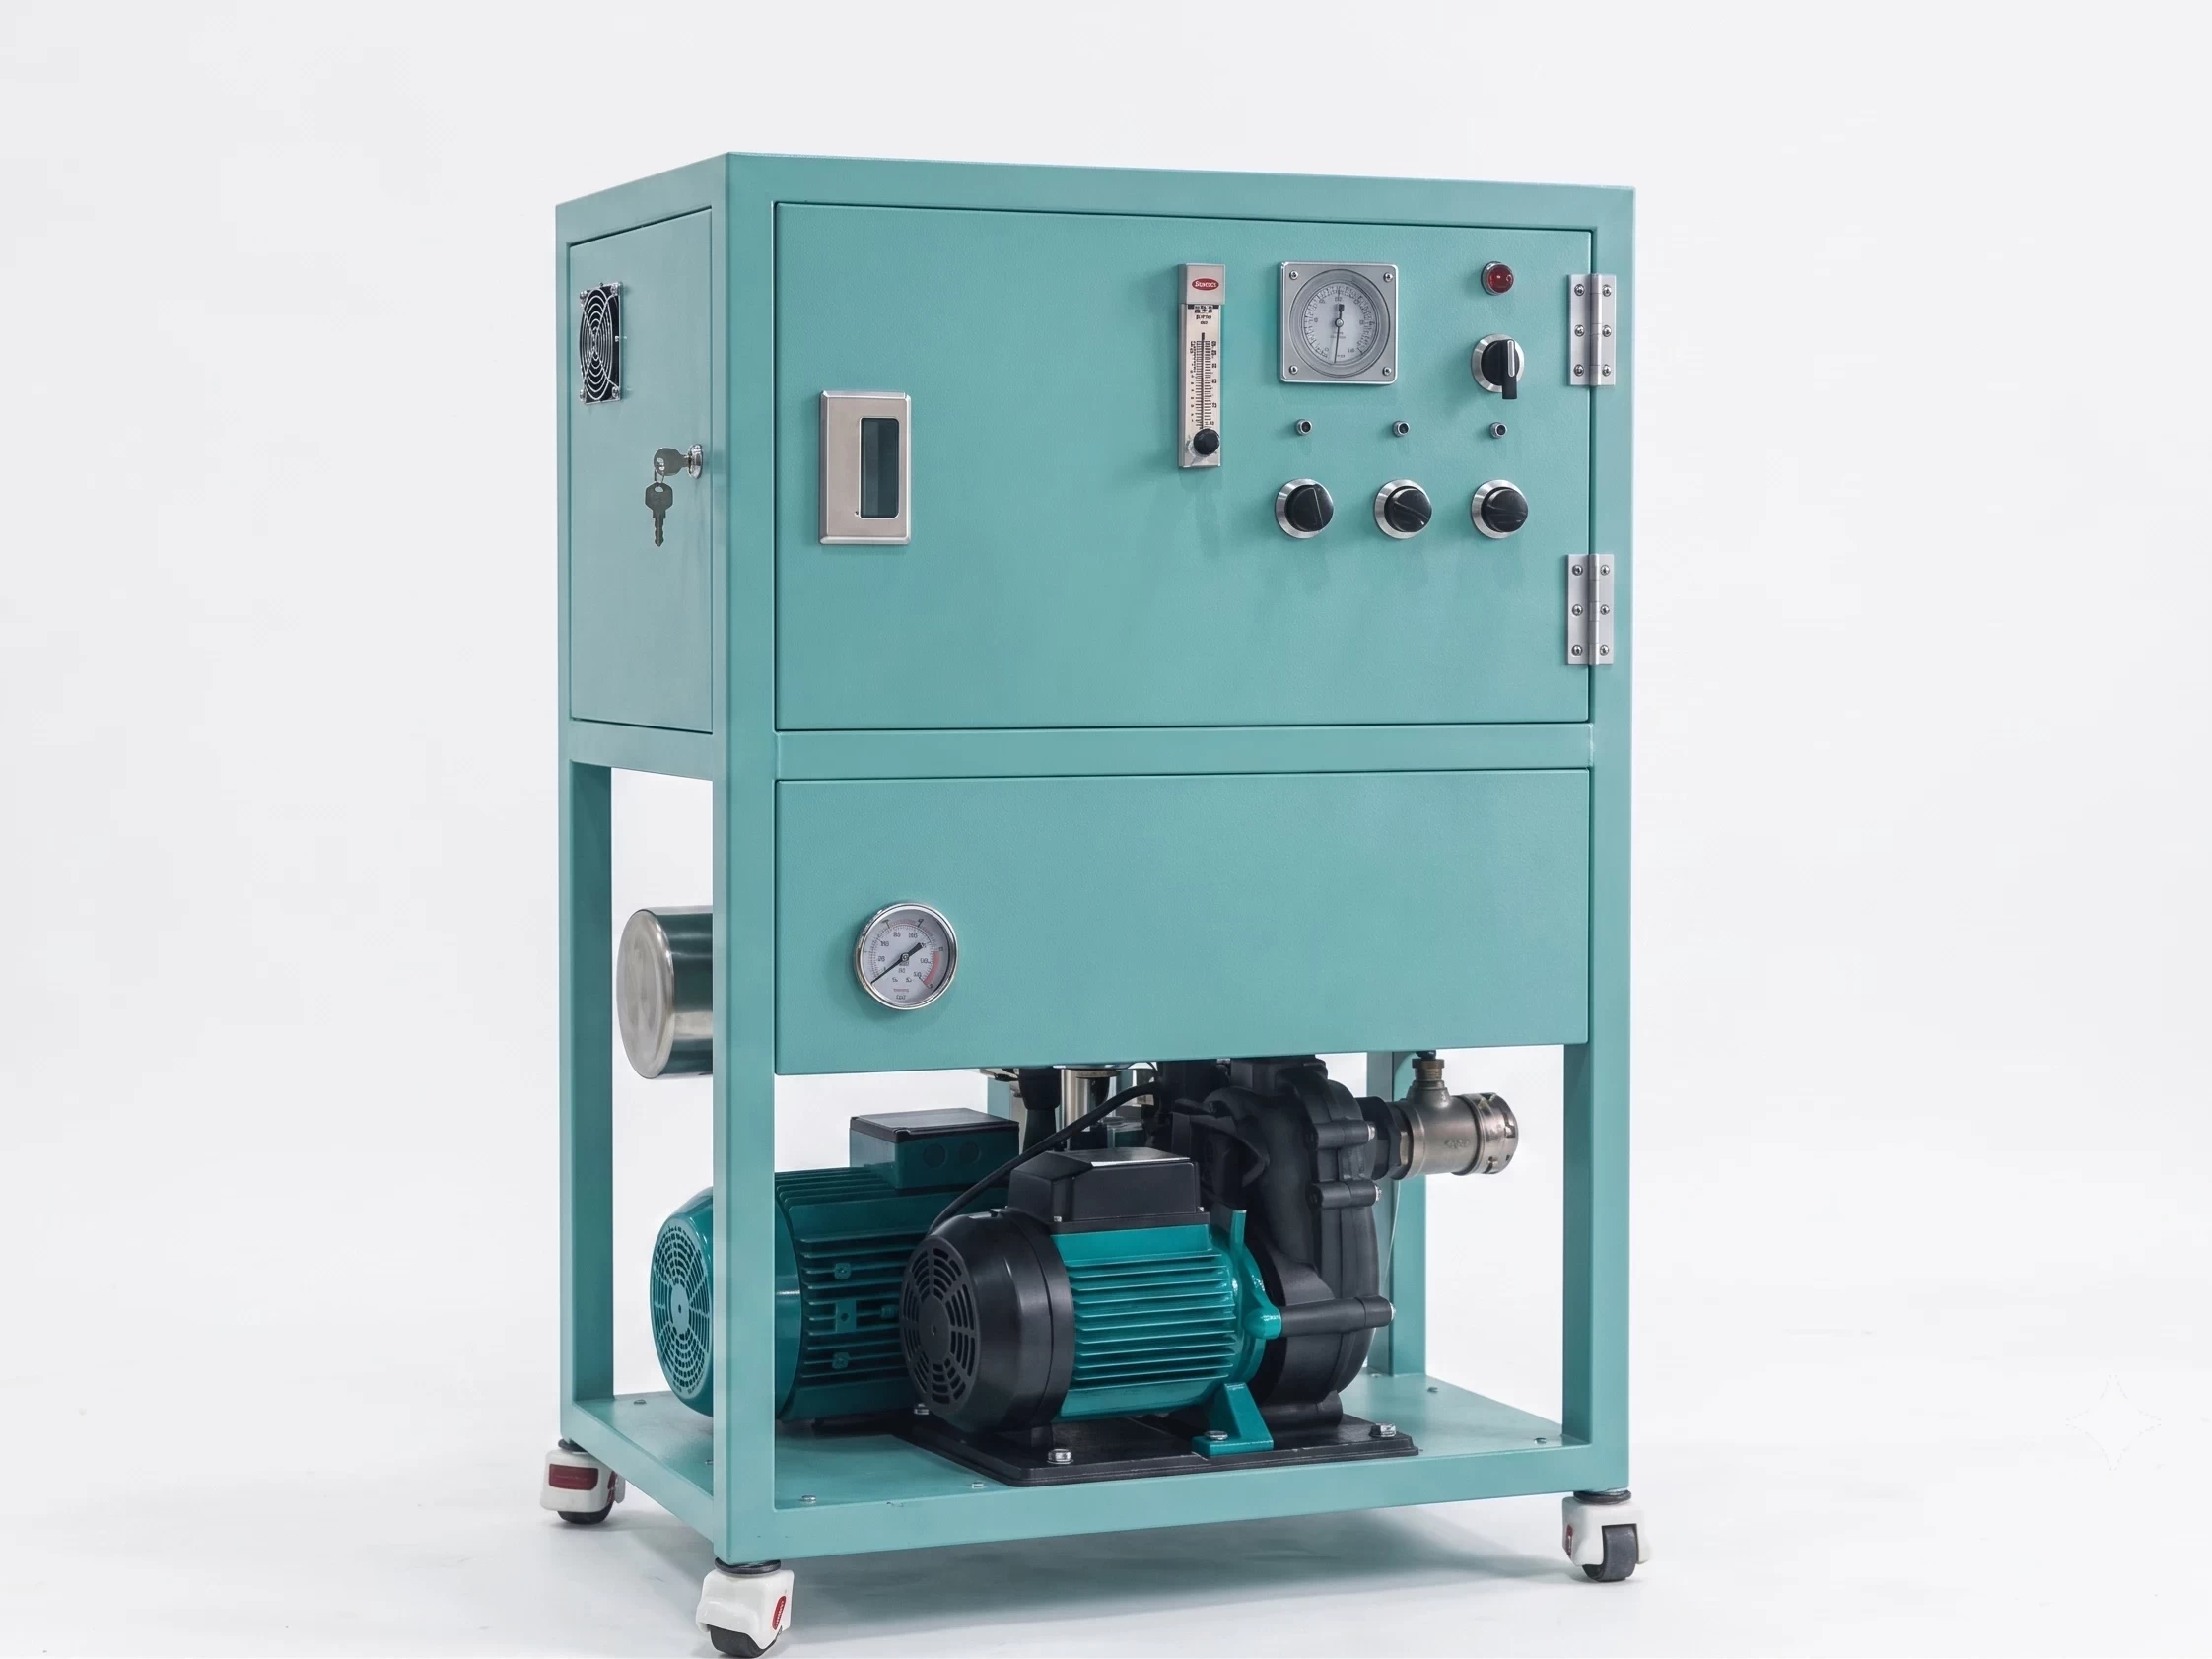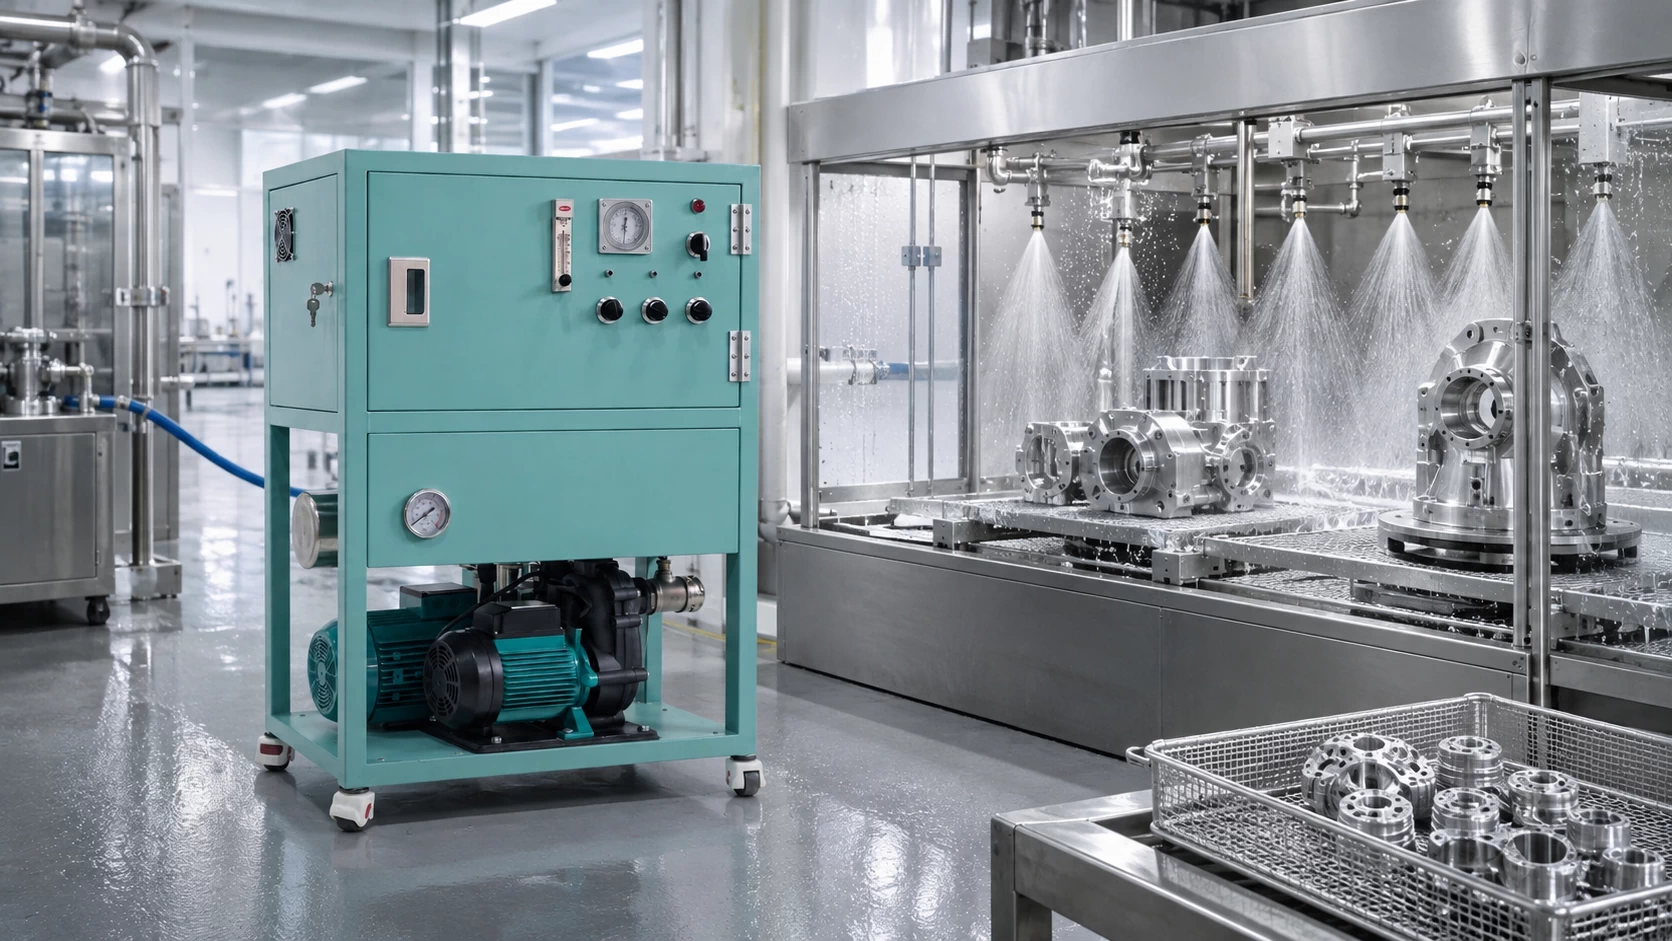
Water sprayed from a high-pressure nozzle to clean a surface
Cleaning & Washing > Surface cleaning

Effects of nanobubbles on surface cleaning

Changes in the amount of contamination left after surfaces are washed with nanobubble water.

Key results

2 fully removed

Better cleaning performance

4 oil-based markers on glass, vs. tap water spray (September 2025)

In-house test Estimate

2 of 4 types

Fully removed

The other 2 partly removed. With tap water, 2 were almost removed and 2 largely remained

In-house test Observation

2.5 bar

Spray pressure

Compared at a lower pressure than the tap water spray (4.5 bar)

In-house test Measurement

Honour Tech's cleaning comparison test, together with published research.

  • Car wash
  • Dishwashing
  • Glass
  • Metal
  • Precision parts
  • Electronic parts
  • Semiconductors
In-house test
1 (3 test runs)
Research cases
4

Glass surface cleaning comparison test

Oil-based marker drawn on glass was sprayed with tap water or nanobubble water, and the remaining marks were compared.

2 of 4 oil-based markers fully removed

In-house test

Tap water and nanobubble water were sprayed with the same equipment and nozzle, and the removal of 4 oil-based markers drawn on glass was compared.

2 markers

Fully removed Observation

The other 2 partly removed. With tap water, 2 were almost removed and 2 were only partly removed

2 of 4 types

Better cleaning performance Estimate

This is based on visual observation and is distinct from quantitative measurement by instrumental analysis.

Basis of comparison: tap water spray (4.5 bar) · Nanobubble water was sprayed at 2.5 bar, so this is not a comparison at the same pressure.

Test conditions, results table by marker and photos

Test conditions

Target
Four oil-based markers on a glass surface; two of them normally require rubbing with acetone to remove
Test date
September 10, 2025 (earlier tests: November 2024, January 2025)
Treatment
Nanobubble water. Nozzle pressure 2.5 bar, gas 1 L/min
Control
Tap water. Nozzle pressure 4.5 bar, no gas
Spray conditions
Same nozzle, 2 minutes of spraying per surface. Flow rate 1,200 L/h
Evaluation
Visual comparison of marks remaining after cleaning
Test equipment
Test rig consisting of a nanobubble mixer and a 1.5 HP pump
Current corresponding product
HQN

Cleaning results by marker

Swipe left or right to see the full table.

Cleaning result comparison for 4 oil-based markers
Marker Tap water (4.5 bar) Nanobubble water (2.5 bar)
Marker 1 (permanent marker) Almost removed Fully removed
Marker 2 (permanent marker, red) Surface layer removed only Partly removed
Marker 3 (liquid oil-based marker) Hardly removed Partly removed
Marker 4 (fine oil-based pen) Almost removed Fully removed

The lower nozzle pressure for nanobubble water is due to the pressure drop across the mixer. This is not a comparison at the same pressure.

Photos
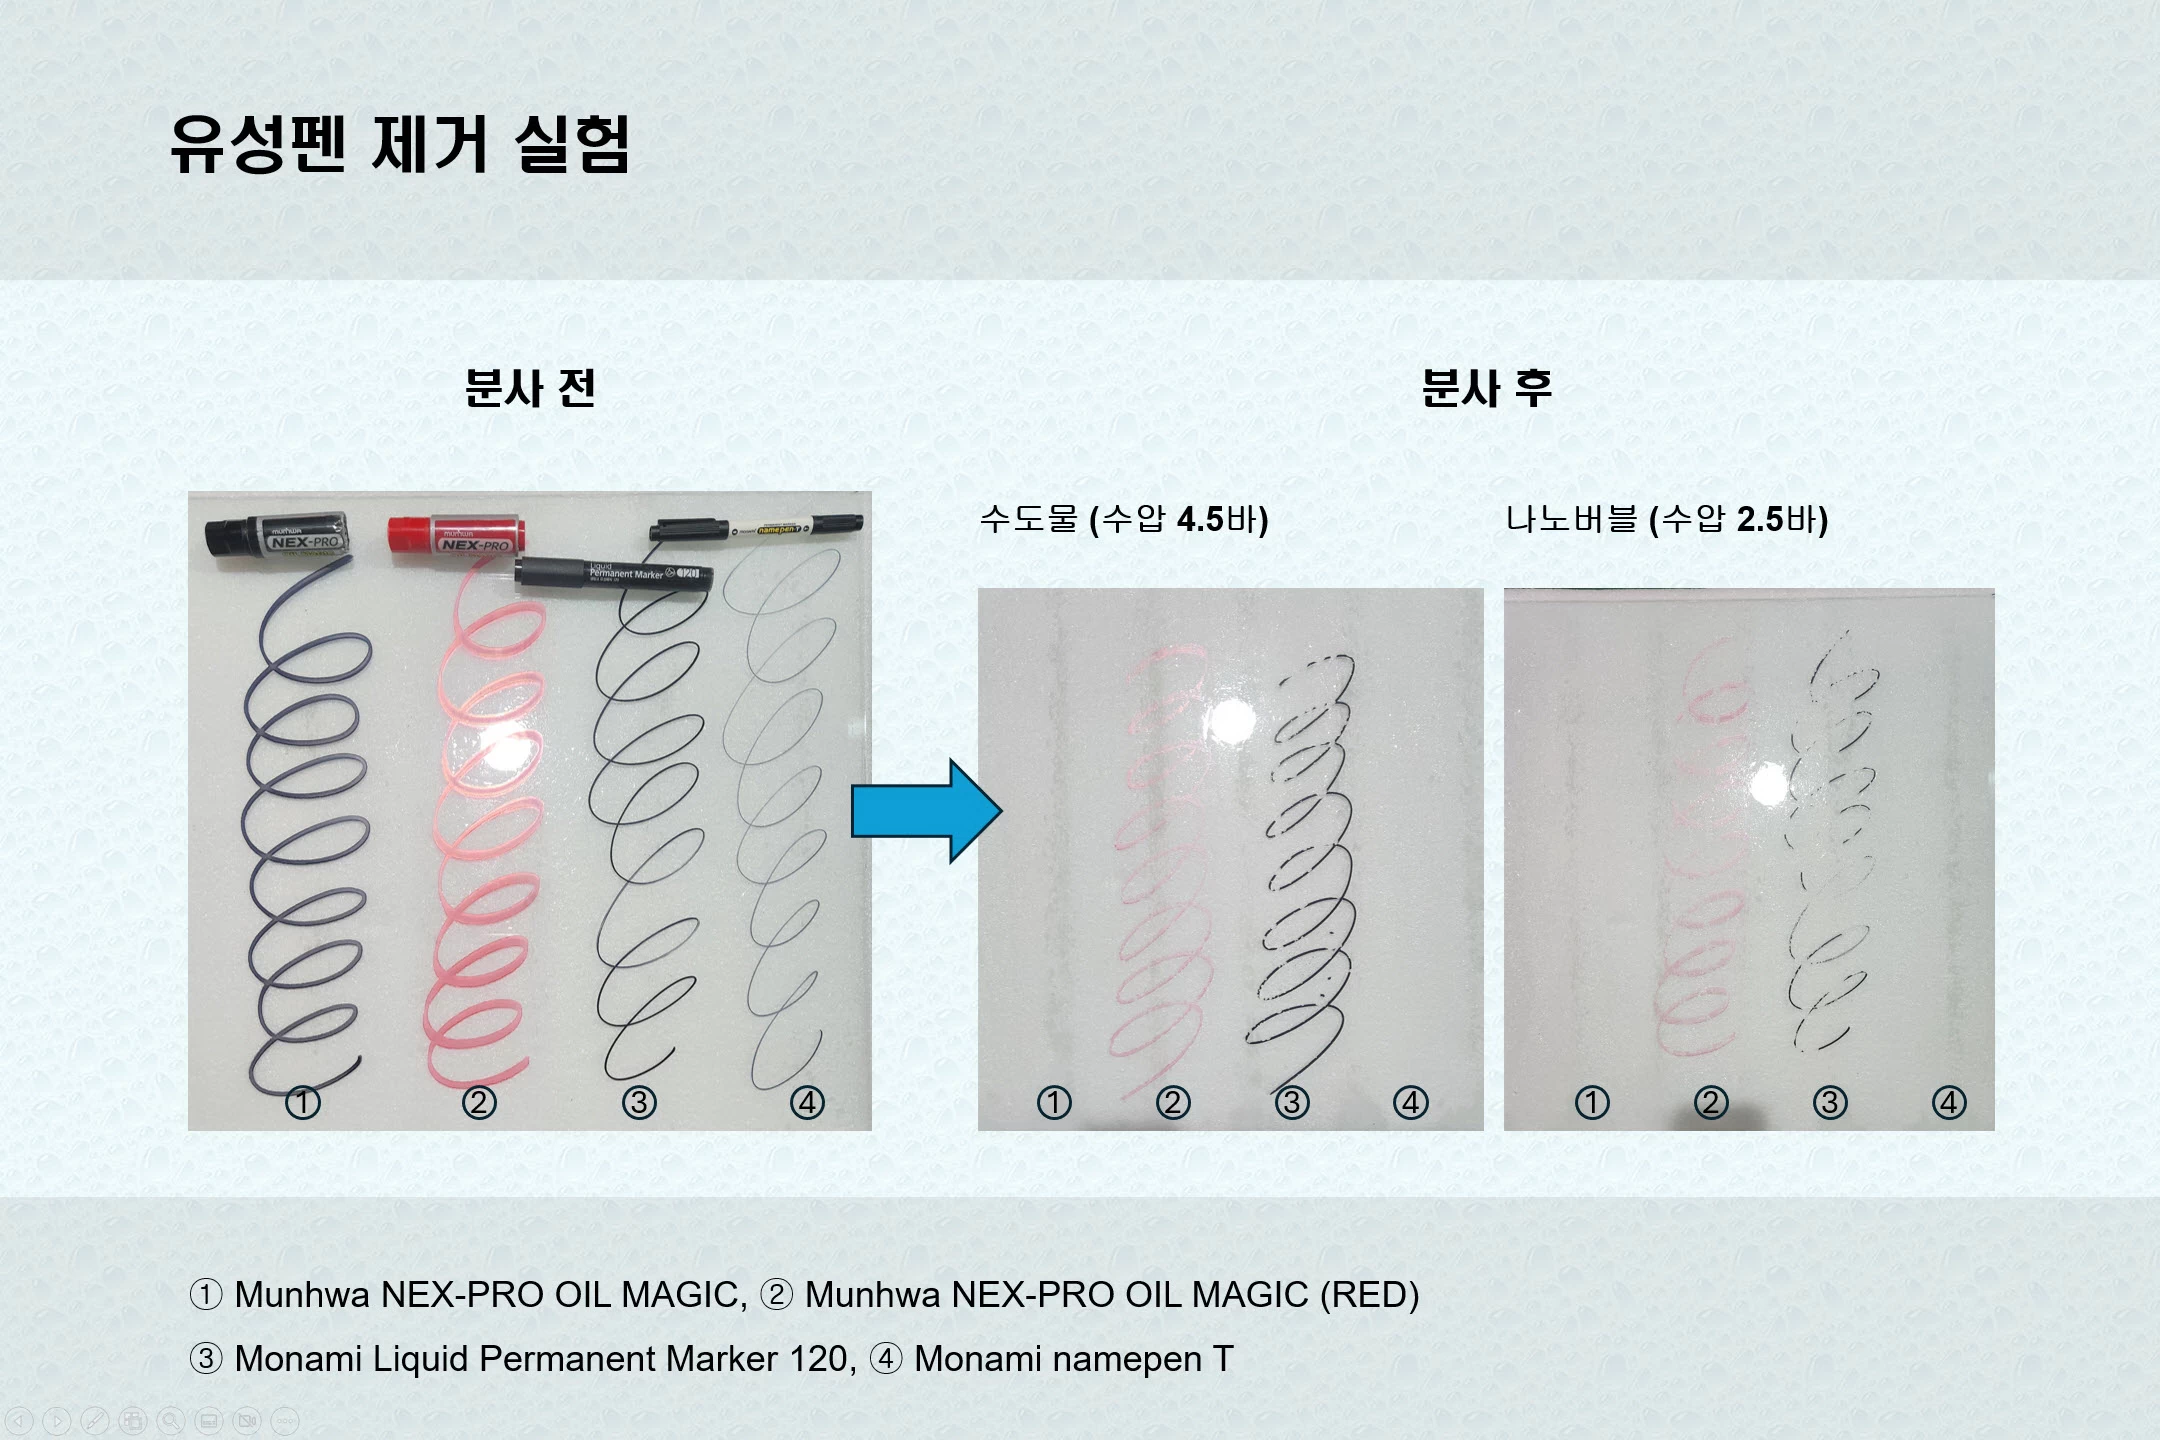
Cleaning comparison of oil-based marker on glass with tap water and nanobubble water
Oil-based pen removal test results

Results reported in published research

These are results from published research, not performance measured with Honour Tech products. We selected representative studies from peer-reviewed papers and public research reports and do not include corporate promotional material. Studies in which the effect was unclear are included as well. Last reviewed: October 2026.

Positive studies 3

  • +29%

    Oil cleaning efficiency

    Microbubble water jet, vs. water-only jet

    Oil cleaning efficiency up 29% with a microbubble water jet

    Microbubble water jet, vs. water-only jet

    Paper details and results

    Effective and environment-friendly oil removal with microbubble jet

    Effective and environment-friendly oil removal with a microbubble jet

    Citation
    Woo et al. · 2025 · Separation and Purification Technology 357, 130076
    Summary
    Microbubbles generated by ultrasound were mixed into a water jet to wash oil from solid surfaces, and differences by water temperature, ultrasound intensity and surfactant concentration were examined.
    Key findings
    The jet spread 7% faster and cleaned a wider area. This is a microbubble study, and the result appeared together with the force of the jet.
    View original (opens in a new window)
  • 85% vs. 7%

    Oil removal (microchannel, 90 seconds)

    Nanobubble water vs. ultrapure water

    Microchannel oil removal of 85% with nanobubble water vs. 7% with ultrapure water

    Nanobubble water vs. ultrapure water

    Paper details and results

    Surface Cleaning of Oil Contaminants Using Bulk Nanobubbles

    Surface cleaning of oil contaminants using bulk nanobubbles

    Citation
    Hansen et al. · 2024 · ChemSusChem 17(21), e202400802
    Summary
    Sunflower oil on glass, microchannels and ceramic dishes was washed with nanobubble water made by water electrolysis (about 100 nm, 7.78×10⁸/mL) and compared with ultrapure water.
    Key findings
    In hydrophilic microchannels, about 85% of the oil was removed in 90 seconds, versus about 7% with ultrapure water. When glass was immersed and stirred, oil area fell about 80% in 10 minutes, versus about 20% with ultrapure water. Replicates and statistical tests were not reported.
    Gas used
    Gas produced by water electrolysis
    View original (opens in a new window)
  • 78.5%

    Oil removal from carbon steel (15 minutes)

    6.5% without bubbles. 49.8% for stainless steel

    Oil removal of 78.5% from carbon steel with microbubble cleaning

    6.5% without bubbles. 49.8% for stainless steel

    Paper details and results

    Microbubbles for Effective Cleaning of Metal Surfaces Without Chemical Agents

    Microbubbles for chemical-free cleaning of metal surfaces

    Citation
    Li et al. · 2022 · Langmuir 38(2), 769–776
    Summary
    Oil was washed from carbon steel and stainless steel surfaces with air microbubbles produced by hydrodynamic cavitation and compared with bubble-free water.
    Key findings
    Without bubbles, removal was 6.5% on carbon steel and 9.9% on stainless steel. Combined with ultrasound, removal reached 85.5% after 3 minutes, versus 69.0% with ultrasound alone. This is a microbubble study.
    Gas used
    Air
    View original (opens in a new window)

Neutral studies 1

  • Insufficient removal

    Protein (nanobubbles alone)

    Combined with surfactant, it was fully removed from hydrophilic surfaces.

    Nanobubble treatment alone does not sufficiently remove protein fouling

    Combined with surfactant, it was fully removed from hydrophilic surfaces.

    Paper details and results

    Improved Cleaning of Hydrophilic Protein-Coated Surfaces using the Combination of Nanobubbles and SDS

    Improved cleaning of protein-fouled hydrophilic surfaces using nanobubbles combined with surfactant (SDS)

    Citation
    Liu, Craig · 2009 · ACS Applied Materials & Interfaces 1(2), 481-487
    Summary
    Hydrophobic and hydrophilic surfaces fouled with protein (lysozyme) were cleaned with nanobubbles, surfactant, or both, and the remaining amounts were compared.
    Key findings
    On hydrophobic surfaces, considerable protein remained even after 10 nanobubble treatments, while surfactant removed about 90%. On hydrophilic surfaces, neither alone removed the protein, but together they removed it completely in 6 cycles.
    Gas used
    Gas generated electrochemically
    View original (opens in a new window)

Frequently Asked Questions

What contamination was the effect confirmed on?

We tested 4 oil-based markers on a glass surface.

2 were fully removed and 2 were partly removed. The results are observations from visually comparing remaining marker traces; cleaning performance on metals and parts is evaluated for each specimen.

Does cleaning work at lower spray pressure?

In the test, nanobubble water was sprayed at 2.5 bar, lower than tap water.

Tap water was sprayed at 4.5 bar, and the nanobubble water had lost pressure across the mixer. This is not a comparison at the same pressure, and results vary with the type of contaminant, surface material, spray pressure and cleaning conditions.

Can we test it before adoption?

We start by agreeing on a test method suited to the items and contaminants to be cleaned.

Just tell us the items and materials to be cleaned, the type of contaminant and your current cleaning method. We have run in-house tests three times since November 2024, and the figures on this page are from the September 2025 test.

How were the studies selected?

We selected representative studies from peer-reviewed published papers.

We include 3 positive studies and 1 study with limited effect. These are not performance measurements of Honour Tech products, and some of the studies address microbubbles.

Tell us the items and materials to be cleaned, the type of contaminant and your current cleaning method, and we will start by reviewing a test method with you.

Contact Us